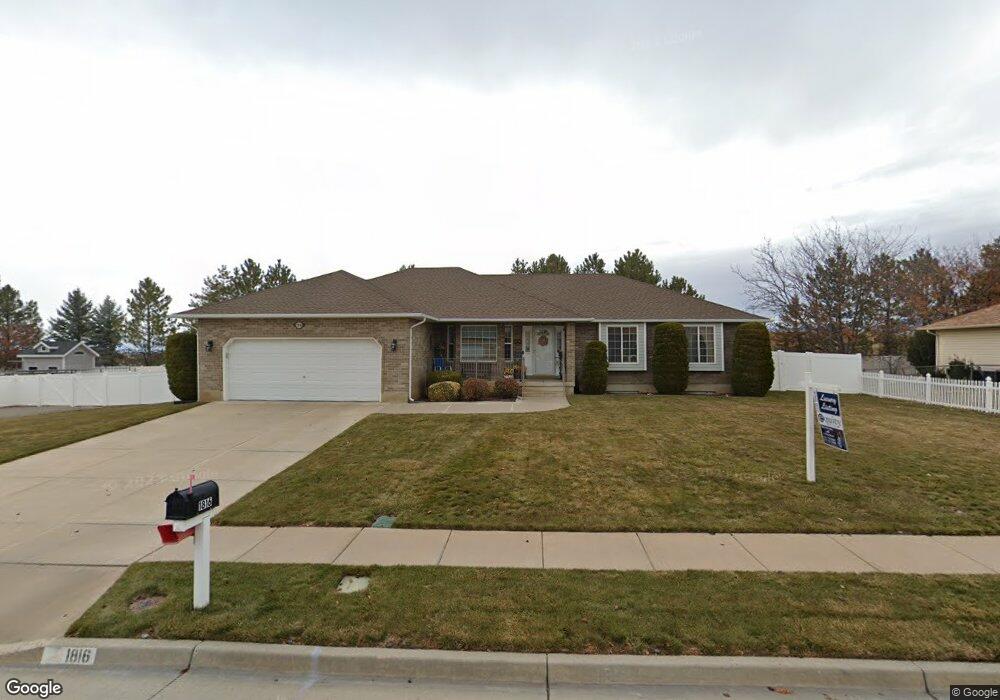
1816 W 1520 N Clearfield, UT 84015
Estimated Value: $586,000 - $674,000
6
Beds
4
Baths
3,540
Sq Ft
$177/Sq Ft
Est. Value
About This Home
This home is located at 1816 W 1520 N, Clearfield, UT 84015 and is currently estimated at $625,881, approximately $176 per square foot. 1816 W 1520 N is a home located in Davis County with nearby schools including Parkside Elementary School, West Point Junior High School, and Clearfield High School.
Ownership History
Date
Name
Owned For
Owner Type
Purchase Details
Closed on
Jan 6, 2025
Sold by
Ostler George A and Ostler Linda E
Bought by
Ostler Family Trust and Ostler
Current Estimated Value
Purchase Details
Closed on
Feb 7, 2023
Sold by
Williams Dianne
Bought by
Ostler Goorge A and Ostler Linda E
Home Financials for this Owner
Home Financials are based on the most recent Mortgage that was taken out on this home.
Original Mortgage
$287,500
Interest Rate
6.09%
Mortgage Type
New Conventional
Purchase Details
Closed on
May 8, 2018
Sold by
Williams Wesley J and Williams Dianne
Bought by
Williams Wesley John and Williams Dianne
Home Financials for this Owner
Home Financials are based on the most recent Mortgage that was taken out on this home.
Original Mortgage
$280,800
Interest Rate
4.44%
Mortgage Type
New Conventional
Create a Home Valuation Report for This Property
The Home Valuation Report is an in-depth analysis detailing your home's value as well as a comparison with similar homes in the area
Home Values in the Area
Average Home Value in this Area
Purchase History
| Date | Buyer | Sale Price | Title Company |
|---|---|---|---|
| Ostler Family Trust | -- | None Listed On Document | |
| Ostler Goorge A | -- | Backman Title Services | |
| Williams Wesley John | -- | -- |
Source: Public Records
Mortgage History
| Date | Status | Borrower | Loan Amount |
|---|---|---|---|
| Previous Owner | Ostler Goorge A | $287,500 | |
| Previous Owner | Williams Wesley John | $280,800 |
Source: Public Records
Tax History Compared to Growth
Tax History
| Year | Tax Paid | Tax Assessment Tax Assessment Total Assessment is a certain percentage of the fair market value that is determined by local assessors to be the total taxable value of land and additions on the property. | Land | Improvement |
|---|---|---|---|---|
| 2025 | $3,123 | $300,300 | $120,445 | $179,855 |
| 2024 | $3,164 | $305,800 | $128,877 | $176,923 |
| 2023 | $2,986 | $534,000 | $152,839 | $381,161 |
| 2022 | $2,819 | $278,850 | $86,052 | $192,798 |
| 2021 | $2,466 | $362,000 | $120,496 | $241,504 |
| 2020 | $2,162 | $314,000 | $109,791 | $204,209 |
| 2019 | $2,206 | $313,000 | $114,847 | $198,153 |
| 2018 | $2,073 | $289,000 | $95,360 | $193,640 |
| 2016 | $1,944 | $139,975 | $38,574 | $101,401 |
| 2015 | $1,902 | $130,185 | $38,574 | $91,611 |
| 2014 | $2,082 | $144,749 | $38,574 | $106,175 |
| 2013 | -- | $128,944 | $34,673 | $94,271 |
Source: Public Records
Map
Nearby Homes