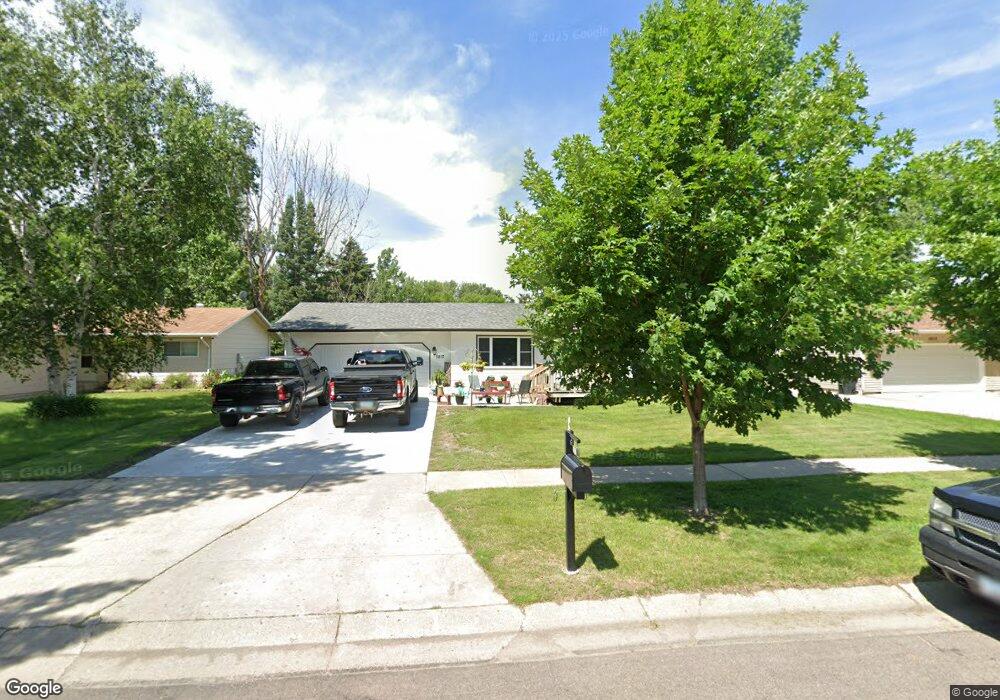
1817 18th St S Fargo, ND 58103
South High NeighborhoodEstimated Value: $285,000 - $344,000
3
Beds
1
Bath
1,320
Sq Ft
$233/Sq Ft
Est. Value
About This Home
This home is located at 1817 18th St S, Fargo, ND 58103 and is currently estimated at $307,897, approximately $233 per square foot. 1817 18th St S is a home located in Cass County with nearby schools including Lewis & Clark Elementary School, Carl Ben Eielson Middle School, and South High School.
Ownership History
Date
Name
Owned For
Owner Type
Purchase Details
Closed on
Oct 10, 2014
Sold by
Lenz Kent E and Lenz Michelle F
Bought by
Trimmer Harold K and Trimmer Vicki R
Current Estimated Value
Purchase Details
Closed on
Dec 16, 2011
Sold by
Oster Clarice M
Bought by
Lenz Kent E and Lenz Michelle F
Home Financials for this Owner
Home Financials are based on the most recent Mortgage that was taken out on this home.
Original Mortgage
$141,250
Interest Rate
4.3%
Mortgage Type
FHA
Create a Home Valuation Report for This Property
The Home Valuation Report is an in-depth analysis detailing your home's value as well as a comparison with similar homes in the area
Home Values in the Area
Average Home Value in this Area
Purchase History
| Date | Buyer | Sale Price | Title Company |
|---|---|---|---|
| Trimmer Harold K | $163,000 | Title Co | |
| Lenz Kent E | $145,000 | None Available |
Source: Public Records
Mortgage History
| Date | Status | Borrower | Loan Amount |
|---|---|---|---|
| Previous Owner | Lenz Kent E | $141,250 |
Source: Public Records
Tax History Compared to Growth
Tax History
| Year | Tax Paid | Tax Assessment Tax Assessment Total Assessment is a certain percentage of the fair market value that is determined by local assessors to be the total taxable value of land and additions on the property. | Land | Improvement |
|---|---|---|---|---|
| 2024 | $3,917 | $141,200 | $31,300 | $109,900 |
| 2023 | $3,683 | $133,200 | $31,300 | $101,900 |
| 2022 | $3,506 | $124,500 | $31,300 | $93,200 |
| 2021 | $3,277 | $118,200 | $34,900 | $83,300 |
| 2020 | $2,979 | $107,450 | $34,900 | $72,550 |
| 2019 | $2,795 | $101,350 | $19,400 | $81,950 |
| 2018 | $2,760 | $101,350 | $19,400 | $81,950 |
| 2017 | $2,656 | $98,400 | $19,400 | $79,000 |
| 2016 | $2,379 | $95,550 | $19,400 | $76,150 |
| 2015 | $2,332 | $88,000 | $14,550 | $73,450 |
| 2014 | $2,221 | $81,500 | $14,550 | $66,950 |
| 2013 | $2,103 | $81,500 | $14,550 | $66,950 |
Source: Public Records
Map
Nearby Homes
- 1943 19th St S
- 2320 20th Ave S Unit 7
- 2326 20th Ave S Unit 9
- 1917 16 1 2 St S
- 1737 Park Blvd S
- 1725 Whitestone Cir S
- 1718 15th St S
- 1834 14 1 2 St S
- 2402 18th St S Unit 3
- 1545 15th St S
- 2202 15th Ave S
- 2301 23rd Ave S
- 1543 25th Ave S
- 1710 14th St S
- 1550 14 1 2 St S
- 2440 15th St S Unit B14
- 2402 N Flickertail Dr S Unit 1
- 1405 25th Ave S Unit A201
- 1407 17th St S
- 1361 16th Ave S