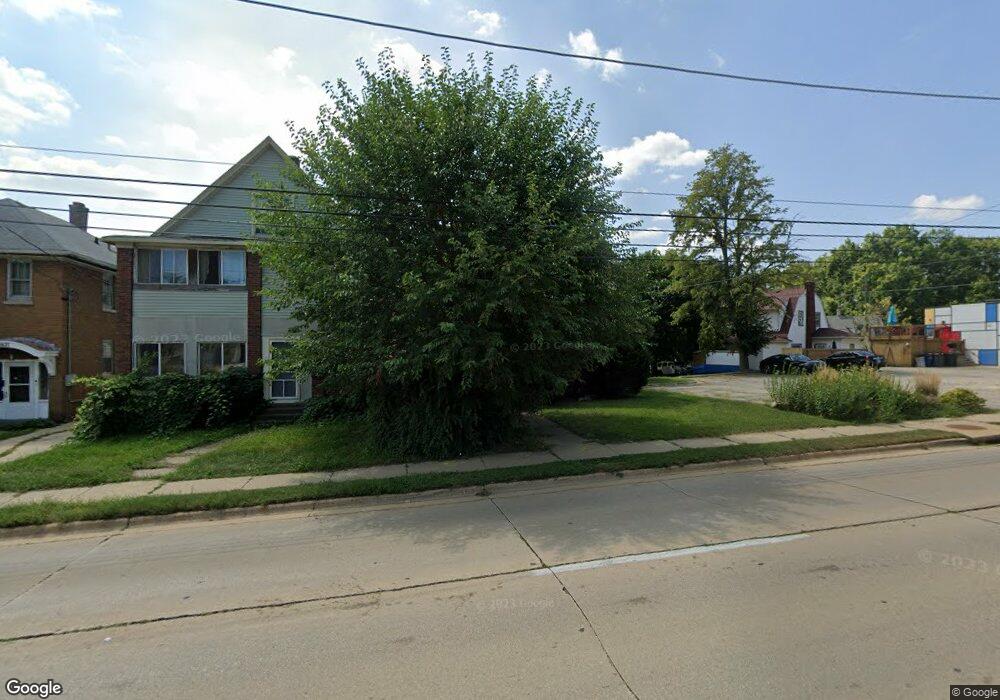
1817 Charles St Rockford, IL 61104
Keith Creek NeighborhoodEstimated Value: $137,000 - $145,000
5
Beds
3
Baths
2,122
Sq Ft
$67/Sq Ft
Est. Value
About This Home
This home is located at 1817 Charles St, Rockford, IL 61104 and is currently estimated at $142,000, approximately $66 per square foot. 1817 Charles St is a home located in Winnebago County with nearby schools including Constance Lane Elementary School, Abraham Lincoln Middle School, and Rockford East High School.
Ownership History
Date
Name
Owned For
Owner Type
Purchase Details
Closed on
Apr 26, 2024
Sold by
Poon Sammy
Bought by
Poor Sammy Ky and He Huiling
Current Estimated Value
Purchase Details
Closed on
Apr 22, 2024
Sold by
Poon Sammy
Bought by
Poor Sammy Ky and He Huiling
Purchase Details
Closed on
Jun 13, 2022
Sold by
Huiling He
Bought by
Poon Sammy Ky
Purchase Details
Closed on
Apr 7, 2017
Sold by
Helen Yao
Bought by
Poon Tony
Purchase Details
Closed on
Jun 24, 2005
Bought by
Poon Sammy and Hui Fen Yao
Purchase Details
Closed on
Jul 29, 2004
Sold by
Poon John K
Bought by
Poon Tony W
Create a Home Valuation Report for This Property
The Home Valuation Report is an in-depth analysis detailing your home's value as well as a comparison with similar homes in the area
Home Values in the Area
Average Home Value in this Area
Purchase History
| Date | Buyer | Sale Price | Title Company |
|---|---|---|---|
| Poor Sammy Ky | -- | None Listed On Document | |
| Poor Sammy Ky | -- | None Listed On Document | |
| Poon Sammy Ky | -- | None Listed On Document | |
| Poon Sammy Ky | -- | -- | |
| Poon Tony | -- | None Listed On Document | |
| Poon Sammy | $40,000 | -- | |
| Poon Tony W | -- | Metropolitan Title Corporation |
Source: Public Records
Mortgage History
| Date | Status | Borrower | Loan Amount |
|---|---|---|---|
| Closed | Poon Tony W | $30,822 |
Source: Public Records
Tax History Compared to Growth
Tax History
| Year | Tax Paid | Tax Assessment Tax Assessment Total Assessment is a certain percentage of the fair market value that is determined by local assessors to be the total taxable value of land and additions on the property. | Land | Improvement |
|---|---|---|---|---|
| 2024 | $1,904 | $20,095 | $1,165 | $18,930 |
| 2023 | $1,840 | $17,719 | $1,027 | $16,692 |
| 2022 | $1,810 | $15,838 | $918 | $14,920 |
| 2021 | $1,065 | $14,523 | $842 | $13,681 |
| 2020 | $1,118 | $13,729 | $796 | $12,933 |
| 2019 | $1,165 | $13,086 | $759 | $12,327 |
| 2018 | $1,241 | $13,623 | $715 | $12,908 |
| 2017 | $1,290 | $13,037 | $684 | $12,353 |
| 2016 | $1,313 | $12,792 | $671 | $12,121 |
| 2015 | $1,330 | $12,792 | $671 | $12,121 |
| 2014 | $1,217 | $13,227 | $842 | $12,385 |
Source: Public Records
Map
Nearby Homes