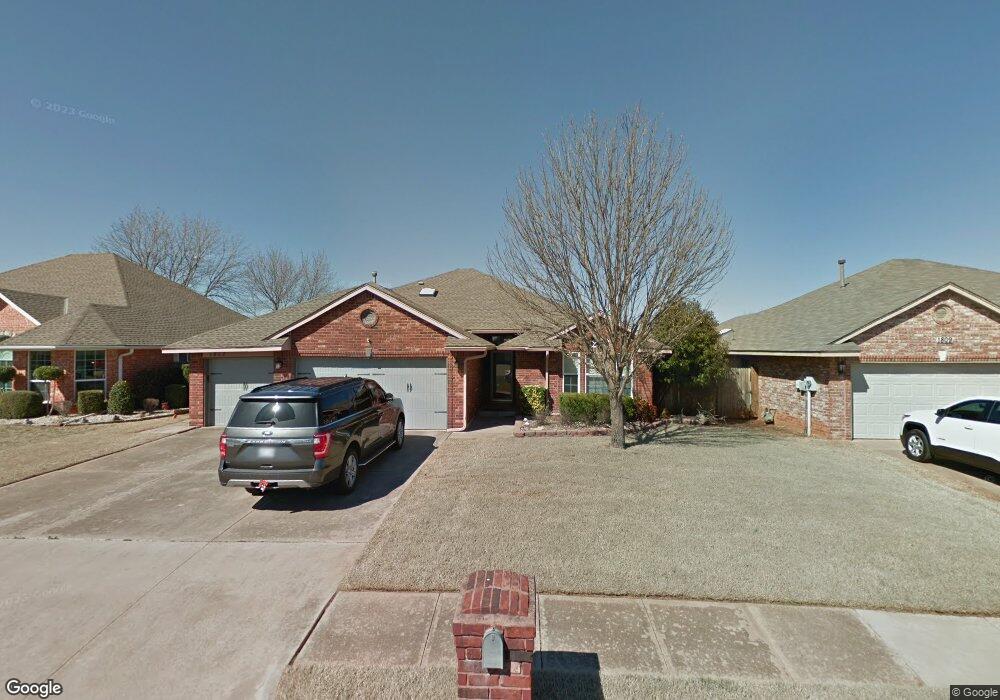
1817 Fairmont Ln Edmond, OK 73013
Traditions-Ripple Creek NeighborhoodEstimated Value: $264,000 - $298,000
3
Beds
2
Baths
1,739
Sq Ft
$161/Sq Ft
Est. Value
About This Home
This home is located at 1817 Fairmont Ln, Edmond, OK 73013 and is currently estimated at $280,083, approximately $161 per square foot. 1817 Fairmont Ln is a home located in Oklahoma County with nearby schools including Charles Haskell Elementary School, Summit Middle School, and Santa Fe High School.
Ownership History
Date
Name
Owned For
Owner Type
Purchase Details
Closed on
Oct 19, 2020
Sold by
Willbanks Charles W and Willbanks Kimberly Dawn
Bought by
Willbanks Charles W and Willbanks Kimberly Dawn
Current Estimated Value
Purchase Details
Closed on
Jun 15, 2006
Sold by
Skinner Dale B and Skinner Sheila F
Bought by
Willbanks Charles W
Home Financials for this Owner
Home Financials are based on the most recent Mortgage that was taken out on this home.
Original Mortgage
$34,400
Interest Rate
6.58%
Mortgage Type
Stand Alone Second
Purchase Details
Closed on
Jun 30, 2003
Sold by
Poddo Robert J and Poddo Deloris G
Bought by
Skinner Dale B and Skinner Sheila F
Purchase Details
Closed on
Aug 31, 2001
Sold by
Arnett Bros Properties Llc
Bought by
Poddo Robert J and Poddo Deloris G
Create a Home Valuation Report for This Property
The Home Valuation Report is an in-depth analysis detailing your home's value as well as a comparison with similar homes in the area
Home Values in the Area
Average Home Value in this Area
Purchase History
| Date | Buyer | Sale Price | Title Company |
|---|---|---|---|
| Willbanks Charles W | -- | Nations Title Agency | |
| Willbanks Charles W | $172,000 | Stewart Abstract & Title Of | |
| Skinner Dale B | $143,500 | Stewart Abstract & Title | |
| Poddo Robert J | $132,000 | Capitol Abstract & Title Co |
Source: Public Records
Mortgage History
| Date | Status | Borrower | Loan Amount |
|---|---|---|---|
| Closed | Willbanks Charles W | $34,400 | |
| Open | Willbanks Charles W | $137,600 |
Source: Public Records
Tax History Compared to Growth
Tax History
| Year | Tax Paid | Tax Assessment Tax Assessment Total Assessment is a certain percentage of the fair market value that is determined by local assessors to be the total taxable value of land and additions on the property. | Land | Improvement |
|---|---|---|---|---|
| 2024 | $2,396 | $24,130 | $3,562 | $20,568 |
| 2023 | $2,396 | $22,981 | $3,577 | $19,404 |
| 2022 | $2,290 | $21,887 | $4,052 | $17,835 |
| 2021 | $2,171 | $20,845 | $3,771 | $17,074 |
| 2020 | $2,099 | $19,910 | $3,771 | $16,139 |
| 2019 | $2,147 | $20,270 | $3,726 | $16,544 |
| 2018 | $2,057 | $19,305 | $0 | $0 |
| 2017 | $2,112 | $19,909 | $3,458 | $16,451 |
| 2016 | $2,066 | $19,524 | $3,458 | $16,066 |
| 2015 | $2,058 | $19,467 | $3,458 | $16,009 |
| 2014 | $1,998 | $18,927 | $3,458 | $15,469 |
Source: Public Records
Map
Nearby Homes
- 1632 Camden Way
- 1617 Camden Way
- 2909 Marigold Ln
- 2104 Tanglewood Dr
- 1800 Napa Valley Rd
- 2125 Hidden Prairie Ct
- 2013 Tanglewood Dr
- 2232 Hidden Prairie Way
- 1608 Shadybrook Ln
- 1912 Whispering Creek Dr
- 15536 Monarch Ln
- 1916 Woodside Dr
- 2201 Tracys Terrace
- 2803 Hidden Prairie Way
- 17 Red Admiral Way
- 15400 Monarch Ln
- 25 Red Admiral Way
- 2200 Lazy Brook Trail
- 1416 Woodgrass Ct
- 15541 Swallowtail Rd
- 1825 Fairmont Ln
- 1809 Fairmont Ln
- 1816 Hemingway Dr
- 1808 Hemingway Dr
- 1824 Hemingway Dr
- 1833 Fairmont Ln
- 1801 Fairmont Ln
- 1816 Fairmont Ln
- 1824 Fairmont Ln
- 1800 Hemingway Dr
- 1832 Hemingway Dr
- 1808 Fairmont Ln
- 1832 Fairmont Ln
- 1841 Fairmont Ln
- 1725 Fairmont Ln
- 1800 Fairmont Ln
- 1724 Hemingway Dr
- 1840 Hemingway Dr
- 1840 Fairmont Ln
- 1817 Camden Way