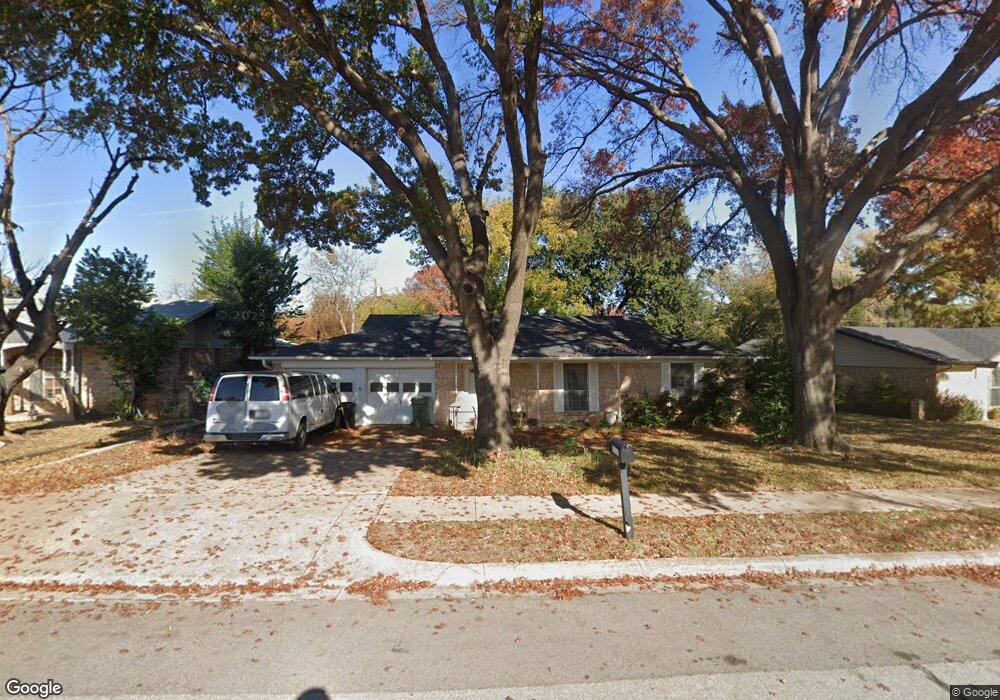
1817 Knoxville Dr Bedford, TX 76022
Estimated Value: $299,000 - $367,000
3
Beds
2
Baths
1,468
Sq Ft
$216/Sq Ft
Est. Value
About This Home
This home is located at 1817 Knoxville Dr, Bedford, TX 76022 and is currently estimated at $317,655, approximately $216 per square foot. 1817 Knoxville Dr is a home located in Tarrant County with nearby schools including Bell Manor Elementary School, Central J High School, and Trinity High School.
Ownership History
Date
Name
Owned For
Owner Type
Purchase Details
Closed on
Nov 15, 2012
Sold by
Haden Thoams
Bought by
Eberly John M and Cooper Paula A
Current Estimated Value
Home Financials for this Owner
Home Financials are based on the most recent Mortgage that was taken out on this home.
Original Mortgage
$89,600
Outstanding Balance
$15,896
Interest Rate
3.37%
Mortgage Type
New Conventional
Estimated Equity
$301,759
Purchase Details
Closed on
Feb 27, 2001
Sold by
Haden John and Haden Merle
Bought by
Something Old Something New Homes Inc
Home Financials for this Owner
Home Financials are based on the most recent Mortgage that was taken out on this home.
Original Mortgage
$40,587
Interest Rate
7.19%
Mortgage Type
Seller Take Back
Create a Home Valuation Report for This Property
The Home Valuation Report is an in-depth analysis detailing your home's value as well as a comparison with similar homes in the area
Home Values in the Area
Average Home Value in this Area
Purchase History
| Date | Buyer | Sale Price | Title Company |
|---|---|---|---|
| Eberly John M | -- | None Available | |
| Something Old Something New Homes Inc | -- | Safeco Land Title |
Source: Public Records
Mortgage History
| Date | Status | Borrower | Loan Amount |
|---|---|---|---|
| Open | Eberly John M | $89,600 | |
| Previous Owner | Something Old Something New Homes Inc | $40,587 |
Source: Public Records
Tax History Compared to Growth
Tax History
| Year | Tax Paid | Tax Assessment Tax Assessment Total Assessment is a certain percentage of the fair market value that is determined by local assessors to be the total taxable value of land and additions on the property. | Land | Improvement |
|---|---|---|---|---|
| 2025 | $3,733 | $155,320 | $65,000 | $90,320 |
| 2024 | $3,733 | $191,754 | $65,000 | $126,754 |
| 2023 | $3,872 | $201,873 | $45,000 | $156,873 |
| 2022 | $3,655 | $167,350 | $45,000 | $122,350 |
| 2021 | $3,945 | $167,471 | $45,000 | $122,471 |
| 2020 | $4,527 | $190,399 | $45,000 | $145,399 |
| 2019 | $4,700 | $193,479 | $45,000 | $148,479 |
| 2018 | $3,938 | $162,119 | $23,000 | $139,119 |
| 2017 | $3,561 | $147,211 | $23,000 | $124,211 |
| 2016 | $3,205 | $132,475 | $23,000 | $109,475 |
| 2015 | $2,813 | $112,000 | $18,000 | $94,000 |
| 2014 | $2,813 | $112,000 | $18,000 | $94,000 |
Source: Public Records
Map
Nearby Homes
- 1701 Winchester Way
- 933 Charleston Ct
- 952 Charleston Dr
- 1613 Trinity Ct
- 2025 Schumac Ln
- 2024 Charleston Dr
- 2201 Greendale Ct
- 2101 Gettysburg Place
- 1604 Richmond Dr
- 804 Natchez Ave
- 1213 Greendale Dr
- 1031 Boston Blvd
- 1049 Stableway Ln
- 1509 Shirley Way
- 1116 Highpoint Rd
- 828 Gregory Ave
- 904 Nelson Terrace
- 1004 Overhill Dr
- 2421 Creek Villas Dr
- 808 Gregory Ave
- 1821 Knoxville Dr
- 1813 Knoxville Dr
- 1809 Knoxville Dr
- 1812 Winchester Way
- 1816 Winchester Way
- 1816 Knoxville Dr
- 1812 Knoxville Dr
- 1808 Winchester Way
- 1820 Knoxville Dr
- 1805 Knoxville Dr
- 1805 Knoxville Dr
- 1901 Knoxville Dr
- 1808 Knoxville Dr
- 1804 Winchester Way
- 1900 Winchester Way
- 1804 Knoxville Dr
- 1900 Knoxville Dr
- 1801 Knoxville Dr
- 1905 Knoxville Dr
- 1817 Lexington Place