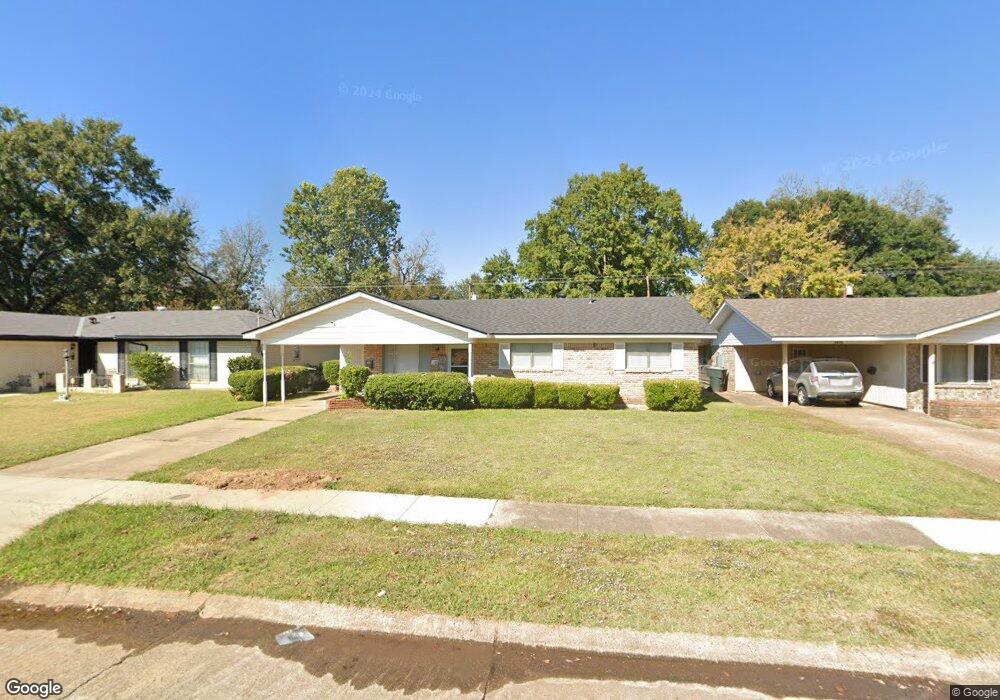
1817 Mars Dr Bossier City, LA 71112
South Bossier NeighborhoodEstimated Value: $152,000 - $168,304
3
Beds
1
Bath
1,313
Sq Ft
$124/Sq Ft
Est. Value
About This Home
This home is located at 1817 Mars Dr, Bossier City, LA 71112 and is currently estimated at $162,576, approximately $123 per square foot. 1817 Mars Dr is a home located in Bossier Parish with nearby schools including Sun City Elementary School, Curtis Elementary School, and Elm Grove Middle School.
Ownership History
Date
Name
Owned For
Owner Type
Purchase Details
Closed on
Apr 30, 2021
Sold by
Sheets Mark A and Sheets Stacie J
Bought by
Oneal-Ruffon Chasity
Current Estimated Value
Home Financials for this Owner
Home Financials are based on the most recent Mortgage that was taken out on this home.
Original Mortgage
$130,138
Outstanding Balance
$117,753
Interest Rate
3%
Mortgage Type
Purchase Money Mortgage
Estimated Equity
$44,823
Purchase Details
Closed on
Mar 28, 2014
Sold by
Gill William and Gill Willie Mae
Bought by
Sheets Mark A and Sheets Stacie J
Home Financials for this Owner
Home Financials are based on the most recent Mortgage that was taken out on this home.
Original Mortgage
$75,600
Interest Rate
4.32%
Mortgage Type
New Conventional
Purchase Details
Closed on
Aug 22, 2008
Sold by
Residential Funding Company Llc
Bought by
Wells Fargo Bank
Purchase Details
Closed on
Sep 8, 2006
Sold by
Reeves Mary
Bought by
Reeves Ken
Create a Home Valuation Report for This Property
The Home Valuation Report is an in-depth analysis detailing your home's value as well as a comparison with similar homes in the area
Home Values in the Area
Average Home Value in this Area
Purchase History
| Date | Buyer | Sale Price | Title Company |
|---|---|---|---|
| Oneal-Ruffon Chasity | $144,900 | None Available | |
| Sheets Mark A | $94,500 | Multiple | |
| Wells Fargo Bank | $95,002 | None Available | |
| Reeves Ken | -- | None Available |
Source: Public Records
Mortgage History
| Date | Status | Borrower | Loan Amount |
|---|---|---|---|
| Open | Oneal-Ruffon Chasity | $130,138 | |
| Previous Owner | Sheets Mark A | $75,600 |
Source: Public Records
Tax History Compared to Growth
Tax History
| Year | Tax Paid | Tax Assessment Tax Assessment Total Assessment is a certain percentage of the fair market value that is determined by local assessors to be the total taxable value of land and additions on the property. | Land | Improvement |
|---|---|---|---|---|
| 2024 | $1,388 | $11,430 | $2,450 | $8,980 |
| 2023 | $1,456 | $11,173 | $2,300 | $8,873 |
| 2022 | $1,198 | $11,173 | $2,300 | $8,873 |
| 2021 | $252 | $11,173 | $2,300 | $8,873 |
| 2020 | $1,112 | $10,387 | $2,300 | $8,087 |
| 2019 | $1,169 | $10,750 | $2,000 | $8,750 |
| 2018 | $1,169 | $10,750 | $2,000 | $8,750 |
| 2017 | $1,398 | $10,750 | $2,000 | $8,750 |
| 2016 | $1,398 | $10,750 | $2,000 | $8,750 |
| 2015 | $239 | $10,500 | $2,000 | $8,500 |
| 2014 | $239 | $10,500 | $2,000 | $8,500 |
Source: Public Records
Map
Nearby Homes
- 4210 Mike St
- 4213 van Deeman St
- 1711 Alison Ave
- 238 Avondale Ln
- 1906 Ray Ave
- 523 Columbia Cir
- 2023 Pluto Dr
- 1710 Shady Grove Dr
- 1904 Carol St
- 4206 Stuart Ave
- 5322 Jonquil St
- 1705 Ray Ave
- 1911 General Jackson Place
- 1615 Success St
- 1806 Dennis St
- 2002 General Jackson Place
- 1701 Avondale Ct
- 3985 Stuart Ave
- 4100 Parkway Dr
- 3986 Stuart Ave