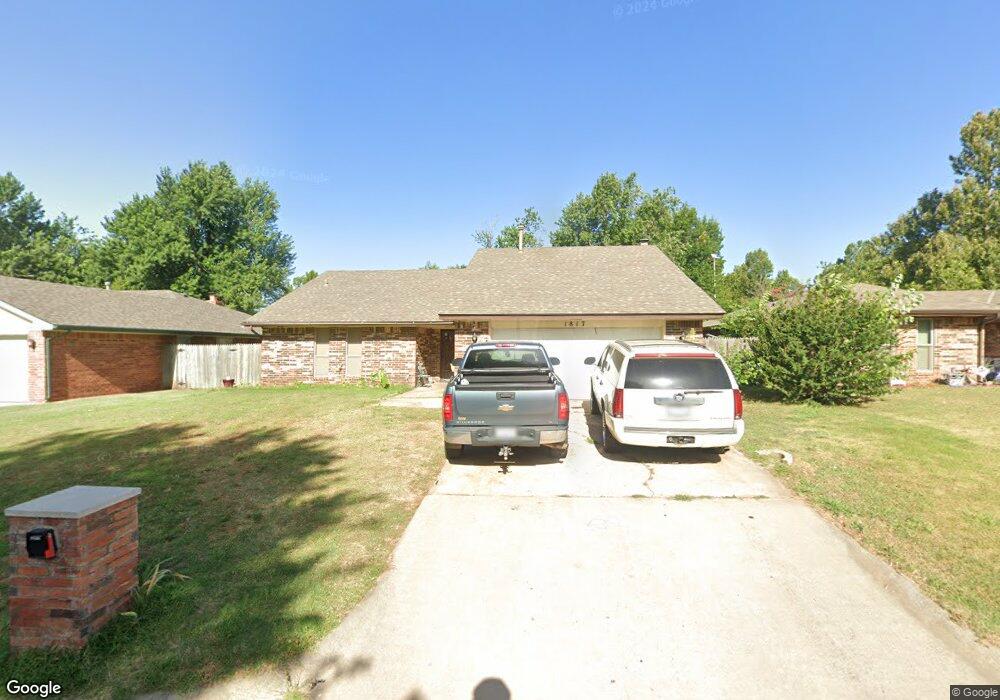
1817 N Gleason Ave Bethany, OK 73008
Estimated Value: $174,000 - $196,000
3
Beds
2
Baths
1,522
Sq Ft
$122/Sq Ft
Est. Value
About This Home
This home is located at 1817 N Gleason Ave, Bethany, OK 73008 and is currently estimated at $185,209, approximately $121 per square foot. 1817 N Gleason Ave is a home located in Oklahoma County with nearby schools including Apollo Elementary School, Mayfield Middle School, and Putnam City West High School.
Ownership History
Date
Name
Owned For
Owner Type
Purchase Details
Closed on
Nov 6, 2021
Sold by
Mcentire Dolores
Bought by
Capps Enterprises Llc
Current Estimated Value
Purchase Details
Closed on
Sep 9, 2021
Sold by
Anderson Ella Mae and Mcintire Dolores
Bought by
Mcentire Dolores
Purchase Details
Closed on
Feb 20, 2015
Sold by
Anderson Ella Mae
Bought by
Anderson Ella Mae and Mcentire Dolores
Purchase Details
Closed on
Dec 30, 2013
Sold by
Mitchell Jack M
Bought by
Mitchell Jack M and The Jack M Mitchell Revocable Trust
Purchase Details
Closed on
Oct 1, 2013
Sold by
Anderson Ella Mae and Lawson Darrel Wayne
Bought by
Mcentire Dolores June and Anderson Ella Mae
Purchase Details
Closed on
Jan 16, 2013
Sold by
Foree Larry A and Foree Vicki L
Bought by
Anderson Ella Mae and Lawson Darrel Wayne
Purchase Details
Closed on
Nov 10, 1998
Sold by
Foree Bernice G
Bought by
Foree Bernice G and Foree Larry Alan
Create a Home Valuation Report for This Property
The Home Valuation Report is an in-depth analysis detailing your home's value as well as a comparison with similar homes in the area
Home Values in the Area
Average Home Value in this Area
Purchase History
| Date | Buyer | Sale Price | Title Company |
|---|---|---|---|
| Capps Enterprises Llc | $70,000 | Oklahoma City Abstract & Tit | |
| Mcentire Dolores | -- | None Available | |
| Anderson Ella Mae | -- | None Available | |
| Mitchell Jack M | -- | None Available | |
| Mcentire Dolores June | -- | None Available | |
| Anderson Ella Mae | $80,000 | None Available | |
| Foree Bernice G | -- | -- |
Source: Public Records
Tax History Compared to Growth
Tax History
| Year | Tax Paid | Tax Assessment Tax Assessment Total Assessment is a certain percentage of the fair market value that is determined by local assessors to be the total taxable value of land and additions on the property. | Land | Improvement |
|---|---|---|---|---|
| 2024 | $2,260 | $19,282 | $2,935 | $16,347 |
| 2023 | $2,260 | $18,364 | $2,951 | $15,413 |
| 2022 | $1,968 | $17,490 | $3,172 | $14,318 |
| 2021 | $802 | $9,152 | $1,912 | $7,240 |
| 2020 | $799 | $9,152 | $1,574 | $7,578 |
| 2019 | $795 | $9,152 | $1,619 | $7,533 |
| 2018 | $790 | $9,152 | $0 | $0 |
| 2017 | $795 | $9,151 | $1,808 | $7,343 |
| 2016 | $783 | $9,151 | $1,859 | $7,292 |
| 2015 | $757 | $9,151 | $1,938 | $7,213 |
| 2014 | $725 | $9,151 | $2,413 | $6,738 |
Source: Public Records
Map
Nearby Homes
- 2201 N Mueller Ave
- 2117 N Keeton Ave
- 2305 N Gleason Ave
- 2312 N Donald Ave
- 2317 N Redmond Ave
- 7183 NW 16th St Unit 1/2
- 7115 NW 16th St Unit 7115
- 7111 NW 16th St
- 7123 NW 16th St Unit 7123
- 2112 N Wilburn Ave
- 2104 N Wilburn Ave
- 1847 N Allen Ln
- 2528 Oakridge Dr
- 6606 NW 26th St
- 7001 NW 12th St
- 6701 NW 26th St
- 7029 NW 12th St
- 2700 N Holloway Ave
- 2528 N Peniel St
- 1231 N Chisholm Rd
- 1821 N Gleason Ave
- 1813 N Gleason Ave
- 1705 N Gleason Ave
- 1825 N Gleason Ave
- 1809 N Gleason Ave
- 6716 NW 18th Cir
- 1706 N Gleason Ave Unit 1706
- 1704 N Gleason Ave
- 1702 N Gleason Ave Unit 1702
- 6717 NW 17th Cir
- 1901 N Gleason Ave
- 6712 NW 18th Cir
- 6713 NW 17th Cir
- 1905 N Gleason Ave
- 6717 NW 18th Cir
- 6708 NW 18th Cir
- 1801 N Gleason Ave
- 6720 NW 17th Cir
- 6713 NW 18th Cir
- 6709 NW 17th Cir