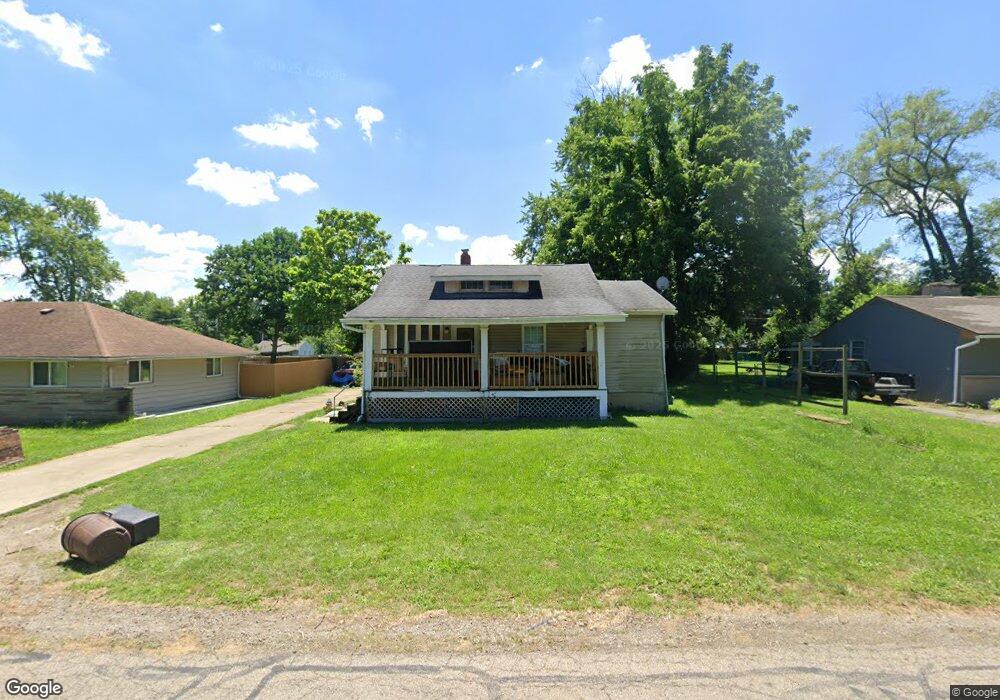
1817 Sale Rd Columbus, OH 43224
North Linden NeighborhoodEstimated Value: $178,831 - $216,000
3
Beds
1
Bath
1,242
Sq Ft
$156/Sq Ft
Est. Value
About This Home
This home is located at 1817 Sale Rd, Columbus, OH 43224 and is currently estimated at $193,708, approximately $155 per square foot. 1817 Sale Rd is a home located in Franklin County with nearby schools including North Linden Elementary School, Medina Middle School, and Mifflin High School.
Ownership History
Date
Name
Owned For
Owner Type
Purchase Details
Closed on
Jan 1, 2005
Sold by
Habtemariam Aster
Bought by
Berhe Inc
Current Estimated Value
Purchase Details
Closed on
Apr 24, 2004
Sold by
Desta Management Inc
Bought by
Habtemariam Aster
Purchase Details
Closed on
Oct 1, 2003
Sold by
Brown Real Estate Inc
Bought by
Desta Management Inc
Purchase Details
Closed on
Dec 21, 2000
Sold by
Stygler Jon S
Bought by
Brown Real Estate Inc
Home Financials for this Owner
Home Financials are based on the most recent Mortgage that was taken out on this home.
Original Mortgage
$26,700
Interest Rate
7.87%
Mortgage Type
Seller Take Back
Purchase Details
Closed on
Nov 7, 2000
Sold by
Stygler Jon S
Bought by
Brown Larry
Home Financials for this Owner
Home Financials are based on the most recent Mortgage that was taken out on this home.
Original Mortgage
$26,700
Interest Rate
7.87%
Mortgage Type
Seller Take Back
Purchase Details
Closed on
Jul 17, 1997
Sold by
Estate Of Henry J Rowan
Bought by
Stygler Jon S
Purchase Details
Closed on
Aug 16, 1991
Create a Home Valuation Report for This Property
The Home Valuation Report is an in-depth analysis detailing your home's value as well as a comparison with similar homes in the area
Home Values in the Area
Average Home Value in this Area
Purchase History
| Date | Buyer | Sale Price | Title Company |
|---|---|---|---|
| Berhe Inc | $66,500 | -- | |
| Habtemariam Aster | $66,600 | -- | |
| Desta Management Inc | $66,600 | -- | |
| Brown Real Estate Inc | $51,300 | Title First Agency Inc | |
| Brown Larry | $28,700 | -- | |
| Stygler Jon S | -- | -- | |
| -- | -- | -- |
Source: Public Records
Mortgage History
| Date | Status | Borrower | Loan Amount |
|---|---|---|---|
| Previous Owner | Brown Larry | $26,700 |
Source: Public Records
Tax History Compared to Growth
Tax History
| Year | Tax Paid | Tax Assessment Tax Assessment Total Assessment is a certain percentage of the fair market value that is determined by local assessors to be the total taxable value of land and additions on the property. | Land | Improvement |
|---|---|---|---|---|
| 2024 | $4,611 | $44,880 | $11,660 | $33,220 |
| 2023 | $2,615 | $44,870 | $11,655 | $33,215 |
| 2022 | $1,118 | $15,020 | $8,020 | $7,000 |
| 2021 | $1,427 | $15,020 | $8,020 | $7,000 |
| 2020 | $1,429 | $19,150 | $8,020 | $11,130 |
| 2019 | $1,214 | $15,020 | $6,410 | $8,610 |
| 2018 | $1,201 | $15,020 | $6,410 | $8,610 |
| 2017 | $1,285 | $15,020 | $6,410 | $8,610 |
| 2016 | $1,358 | $15,200 | $4,940 | $10,260 |
| 2015 | $1,190 | $15,200 | $4,940 | $10,260 |
| 2014 | $1,192 | $15,200 | $4,940 | $10,260 |
| 2013 | $699 | $16,870 | $5,495 | $11,375 |
Source: Public Records
Map
Nearby Homes
- 1863 Ward Rd
- 1734 Ferris Rd
- 1896 Ormond Ave
- 1936 Case Rd
- 1997 Ferris Rd
- 2023 Ferris Rd
- 4111 Walford St
- 3750 Dresden St
- 4057 Estates Place
- 1496 E Cooke Rd
- 4217 Hickman Rd
- 3749 Ganson Dr
- 2015 Melrose Ave
- 1440 E Cooke Rd
- 4309 Walford St
- 1905 Elmore Ave
- 3685 Cleveland Ave
- 2194 Ashley Dr
- 2144 Colfax Ave
- 3967 Karl Rd Unit 125