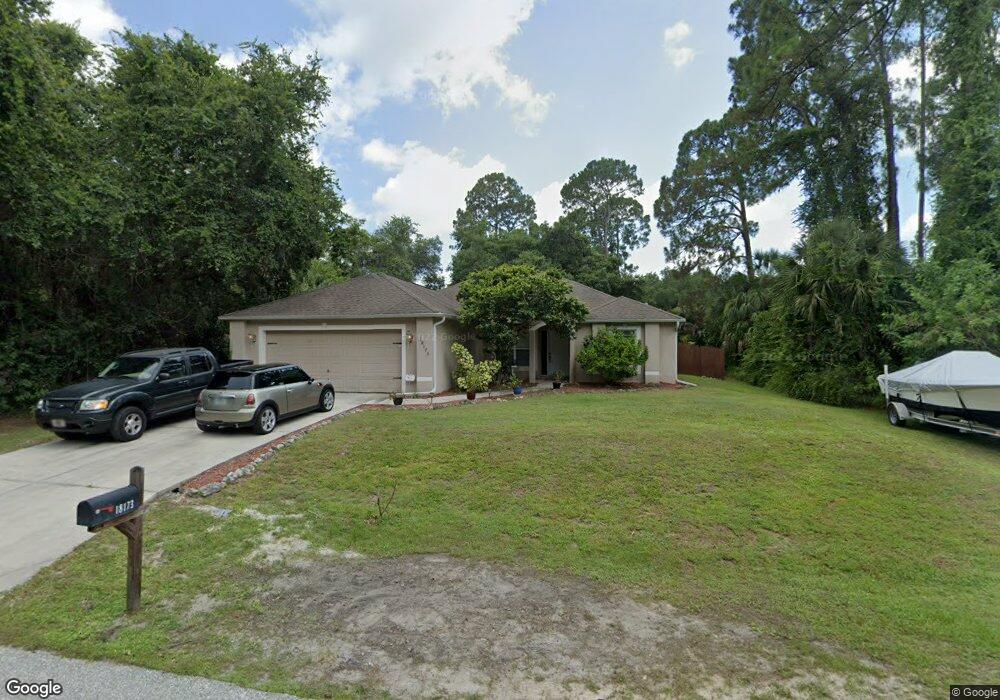
18173 Charter Ave Port Charlotte, FL 33954
Estimated Value: $332,000 - $391,000
3
Beds
2
Baths
1,886
Sq Ft
$189/Sq Ft
Est. Value
About This Home
This home is located at 18173 Charter Ave, Port Charlotte, FL 33954 and is currently estimated at $355,761, approximately $188 per square foot. 18173 Charter Ave is a home located in Charlotte County with nearby schools including Liberty Elementary School, Murdock Middle School, and Port Charlotte High School.
Ownership History
Date
Name
Owned For
Owner Type
Purchase Details
Closed on
Mar 23, 2010
Sold by
Pnc Bank National Association
Bought by
Theriault Susan M
Current Estimated Value
Home Financials for this Owner
Home Financials are based on the most recent Mortgage that was taken out on this home.
Original Mortgage
$113,898
Outstanding Balance
$76,501
Interest Rate
5.25%
Mortgage Type
FHA
Estimated Equity
$279,260
Purchase Details
Closed on
Nov 2, 2009
Sold by
Salminen Kerry and Salminen Dean
Bought by
National City Mortgage Co
Purchase Details
Closed on
Nov 4, 2005
Sold by
Liddell Norman J and Liddell Kimberley A
Bought by
Salminen Kerry and Salminen Dean
Home Financials for this Owner
Home Financials are based on the most recent Mortgage that was taken out on this home.
Original Mortgage
$298,000
Interest Rate
8.5%
Mortgage Type
Construction
Purchase Details
Closed on
Feb 12, 2004
Sold by
Clerk Circuit Court
Bought by
Natl Recreational Prop Pt Charlotte L L
Create a Home Valuation Report for This Property
The Home Valuation Report is an in-depth analysis detailing your home's value as well as a comparison with similar homes in the area
Home Values in the Area
Average Home Value in this Area
Purchase History
| Date | Buyer | Sale Price | Title Company |
|---|---|---|---|
| Theriault Susan M | $116,000 | Attorney | |
| National City Mortgage Co | $105,900 | Attorney | |
| Salminen Kerry | $60,000 | Acurity Title Group Llc | |
| Natl Recreational Prop Pt Charlotte L L | $8,700 | -- |
Source: Public Records
Mortgage History
| Date | Status | Borrower | Loan Amount |
|---|---|---|---|
| Open | Theriault Susan M | $113,898 | |
| Previous Owner | Salminen Kerry | $298,000 |
Source: Public Records
Tax History Compared to Growth
Tax History
| Year | Tax Paid | Tax Assessment Tax Assessment Total Assessment is a certain percentage of the fair market value that is determined by local assessors to be the total taxable value of land and additions on the property. | Land | Improvement |
|---|---|---|---|---|
| 2023 | $1,762 | $105,378 | $0 | $0 |
| 2022 | $1,679 | $102,309 | $0 | $0 |
| 2021 | $1,661 | $99,329 | $0 | $0 |
| 2020 | $1,615 | $97,958 | $0 | $0 |
| 2019 | $1,529 | $95,756 | $0 | $0 |
| 2018 | $1,394 | $93,971 | $0 | $0 |
| 2017 | $1,374 | $92,038 | $0 | $0 |
| 2016 | $1,359 | $90,145 | $0 | $0 |
| 2015 | $1,344 | $89,518 | $0 | $0 |
| 2014 | $1,318 | $88,808 | $0 | $0 |
Source: Public Records
Map
Nearby Homes
- 18149 Dillon Ave
- 18134 Dillon Ave
- 18126 Dillon Ave
- 18037 Ardmore Ave
- 168 Shoreland St
- 177 Overbrook St
- 18168 Zanzibar Ave
- 18404 Jefferson Ave
- 18363 Jefferson Ave
- 18403 Jefferson Ave
- 18300 Jefferson Ave
- 18372 Laramie Ave
- 18349 Laramie Ave
- 18147 Vincent Ave
- 151 Stanhope St
- 18131 Vincent Ave
- 18341 Moonshadow Ave
- 18332 Moonshadow Ave
- 18349 Moonshadow Ave
- 18078 Spartonvail Ave
- 18166 Dillon Ave
- 18182 Dillon Ave
- 18166 Avenue
- 18166 Charter Ave
- 18181 Charter Ave
- 18165 Charter Ave
- 18190 Dillon Ave
- 18133 Dillon Ave
- 18150 Dillon Ave
- 18117 Dillon Ave
- 18158 Charter Ave
- 18197 Charter Ave
- 18150 Avenue
- 18150 Charter Ave
- 18173 Dickens Ave
- 18165 Dickens Ave
- 18189 Dillon Ave
- 18157 Dillon Ave
- 18157 Avenue
- 18149 Dickens Ave