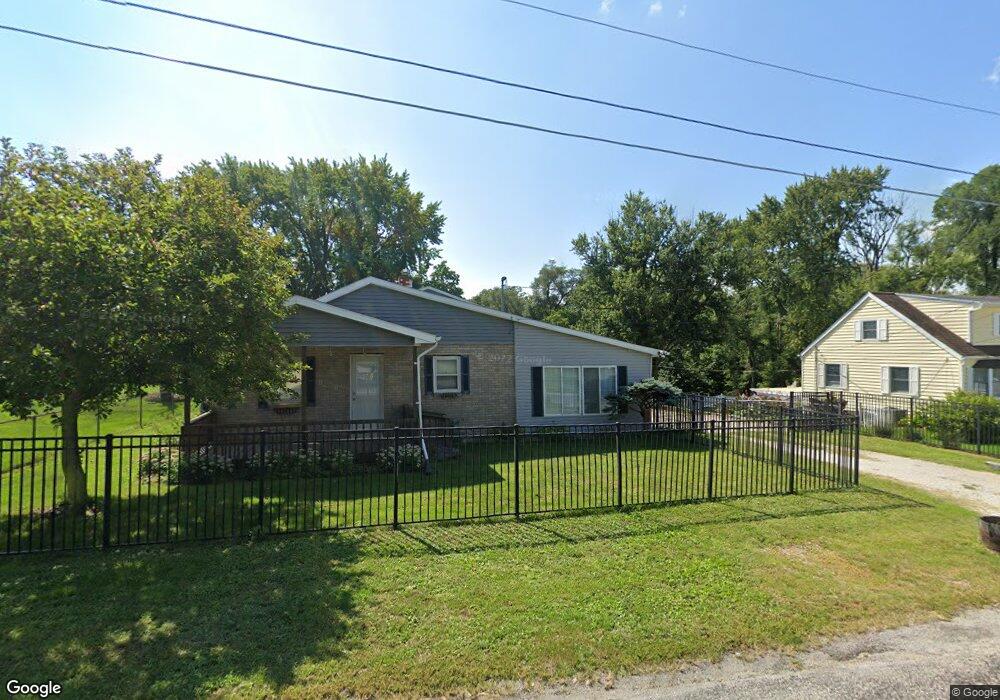
1818 28th Ave East Moline, IL 61244
Estimated Value: $70,000 - $110,339
1
Bed
1
Bath
1,188
Sq Ft
$69/Sq Ft
Est. Value
About This Home
This home is located at 1818 28th Ave, East Moline, IL 61244 and is currently estimated at $82,085, approximately $69 per square foot. 1818 28th Ave is a home located in Rock Island County with nearby schools including Ridgewood Elementary School, Glenview Middle School, and United Township High School.
Ownership History
Date
Name
Owned For
Owner Type
Purchase Details
Closed on
Nov 28, 2022
Sold by
Ajideh Sasan
Bought by
Valipour Shohree
Current Estimated Value
Purchase Details
Closed on
Oct 18, 2017
Sold by
Carrington Mortgage Services Llc
Bought by
Ajideh Sasan
Purchase Details
Closed on
Jul 28, 2017
Sold by
Sheriff Of Rock Island County
Bought by
Carrington Mortgage Services L
Purchase Details
Closed on
Jul 24, 2017
Sold by
Sheriff Of Rock Island County
Bought by
Carrington Mortgage Services L
Create a Home Valuation Report for This Property
The Home Valuation Report is an in-depth analysis detailing your home's value as well as a comparison with similar homes in the area
Home Values in the Area
Average Home Value in this Area
Purchase History
| Date | Buyer | Sale Price | Title Company |
|---|---|---|---|
| Valipour Shohree | -- | -- | |
| Ajideh Sasan | $25,000 | Stojan Law Office Pc | |
| Carrington Mortgage Services L | $20,805 | -- | |
| Carrington Mortgage Services L | $20,805 | -- |
Source: Public Records
Tax History Compared to Growth
Tax History
| Year | Tax Paid | Tax Assessment Tax Assessment Total Assessment is a certain percentage of the fair market value that is determined by local assessors to be the total taxable value of land and additions on the property. | Land | Improvement |
|---|---|---|---|---|
| 2024 | $1,361 | $28,116 | $5,608 | $22,508 |
| 2023 | $1,361 | $26,351 | $5,256 | $21,095 |
| 2022 | $1,419 | $23,734 | $4,734 | $19,000 |
| 2021 | $1,412 | $22,690 | $4,526 | $18,164 |
| 2020 | $1,400 | $22,399 | $4,468 | $17,931 |
| 2019 | $1,378 | $21,992 | $4,387 | $17,605 |
| 2018 | $976 | $17,352 | $4,933 | $12,419 |
| 2017 | $1,240 | $20,338 | $4,841 | $15,497 |
| 2016 | $1,240 | $20,237 | $4,817 | $15,420 |
| 2015 | $1,134 | $18,876 | $4,493 | $14,383 |
| 2014 | $236 | $23,317 | $2,014 | $21,303 |
| 2013 | $236 | $23,317 | $2,014 | $21,303 |
Source: Public Records
Map
Nearby Homes
- 2987 16th Street Ct
- 917 3rd St
- 3043 17th Street Ct
- 3028 16th Street Ct Unit 6
- 627 10th Ave
- 729 11th Avenue B Ct
- 818 9th Ave
- 1124 35th Avenue Ct
- 506 13th Avenue A
- 421 10th Street A
- 2584 9th St
- 2043 12th St
- 130 9th St
- 1012 & 1014 12th St
- 1136 20th Ave
- 142 11th St
- 1415 18th Ave
- The Magnolia Plan at Porter Farms
- The Brookside Plan at Porter Farms
- The Halsted Plan at Porter Farms