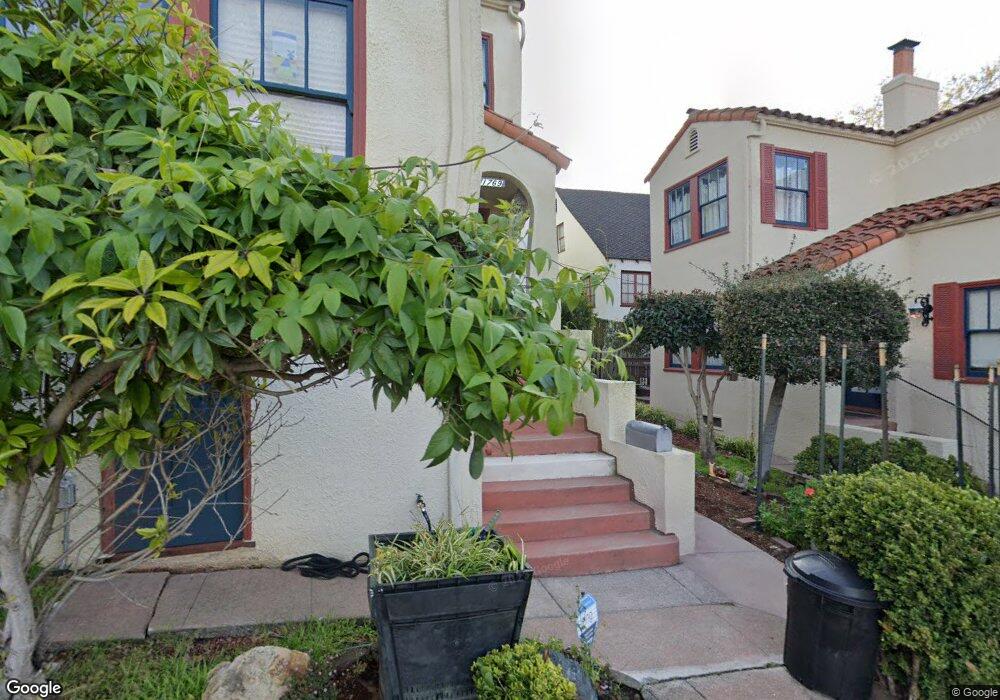
1818 Arch St Berkeley, CA 94709
North Berkeley NeighborhoodEstimated Value: $646,831 - $871,000
Studio
--
Bath
853
Sq Ft
$870/Sq Ft
Est. Value
About This Home
This home is located at 1818 Arch St, Berkeley, CA 94709 and is currently estimated at $741,958, approximately $869 per square foot. 1818 Arch St is a home located in Alameda County with nearby schools including Berkeley Arts Magnet at Whittier School, Washington Elementary School, and Cragmont Elementary School.
Ownership History
Date
Name
Owned For
Owner Type
Purchase Details
Closed on
Nov 18, 2010
Sold by
Chen Yung Ling
Bought by
Chen Yung Ling
Current Estimated Value
Create a Home Valuation Report for This Property
The Home Valuation Report is an in-depth analysis detailing your home's value as well as a comparison with similar homes in the area
Home Values in the Area
Average Home Value in this Area
Purchase History
| Date | Buyer | Sale Price | Title Company |
|---|---|---|---|
| Chen Yung Ling | -- | None Available |
Source: Public Records
Tax History
| Year | Tax Paid | Tax Assessment Tax Assessment Total Assessment is a certain percentage of the fair market value that is determined by local assessors to be the total taxable value of land and additions on the property. | Land | Improvement |
|---|---|---|---|---|
| 2025 | $4,581 | $182,864 | $153,002 | $36,862 |
| 2024 | $4,581 | $179,141 | $150,002 | $36,139 |
| 2023 | $4,465 | $182,492 | $147,061 | $35,431 |
| 2022 | $4,342 | $171,914 | $144,178 | $34,736 |
| 2021 | $4,322 | $168,406 | $141,351 | $34,055 |
| 2020 | $3,997 | $173,608 | $139,902 | $33,706 |
| 2019 | $3,726 | $170,204 | $137,159 | $33,045 |
| 2018 | $3,637 | $166,867 | $134,470 | $32,397 |
| 2017 | $3,487 | $163,595 | $131,833 | $31,762 |
| 2016 | $3,298 | $160,388 | $129,249 | $31,139 |
| 2015 | $3,243 | $157,980 | $127,308 | $30,672 |
| 2014 | $3,198 | $154,886 | $124,815 | $30,071 |
Source: Public Records
Map
Nearby Homes
- 1739 Spruce St
- 2340 Virginia St
- 2301 Virginia St Unit 1
- 2201 Virginia St Unit 2
- 1682 Oxford St
- 2451 Le Conte Ave
- 2421 Hilgard Ave
- 1622 Scenic Ave
- 2477 Virginia St
- 2035 Francisco St
- 1515 Oxford St Unit 1D
- 2015 Hearst Ave
- 2600 Hilgard Ave
- 2634 Virginia St Unit 33
- 1444 Walnut St
- 1610 Milvia St
- 2700 Le Conte Ave Unit 301
- 2700 Le Conte Ave Unit 402
- 1698 La Loma Ave Unit 1698
- 1609 Bonita Ave Unit 5
- 1834 Arch St Unit 1834
- 1832 Arch St Unit 1832
- 1830 Arch St
- 1816 Arch St
- 1814 Arch St
- 1810 Arch St Unit 1810
- 1812 Arch St
- 1826 Arch St Unit 1826
- 1822 Arch St
- 1828 Arch St
- 1820 Arch St Unit 1820
- 1824 Arch St
- 1836 Arch St Unit 1836
- 1800 Arch St
- 1850 Arch St
- 1790 Arch St
- 1771 Spruce St
- 1777 Spruce St
- 1763 Spruce St
- 1767 Spruce St
Your Personal Tour Guide
Ask me questions while you tour the home.