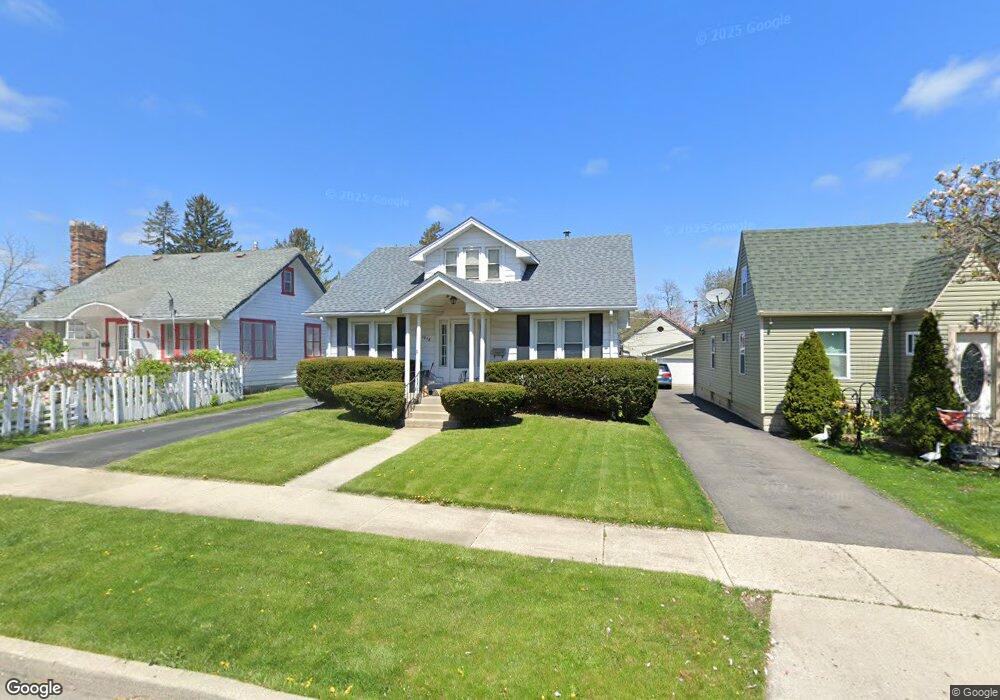
1818 Jenkinson Ct Waukegan, IL 60085
West Waukegan NeighborhoodEstimated Value: $237,000 - $263,000
4
Beds
2
Baths
1,740
Sq Ft
$142/Sq Ft
Est. Value
About This Home
This home is located at 1818 Jenkinson Ct, Waukegan, IL 60085 and is currently estimated at $246,782, approximately $141 per square foot. 1818 Jenkinson Ct is a home located in Lake County with nearby schools including Hyde Park Elementary School, Miguel Juarez Middle School, and Waukegan High School.
Ownership History
Date
Name
Owned For
Owner Type
Purchase Details
Closed on
Oct 15, 2011
Sold by
Castellanos Francisco and Castellanos Oscar
Bought by
Berg Holdings Inc
Current Estimated Value
Purchase Details
Closed on
Oct 24, 2006
Sold by
Sedivy Constance and Estate Of John A Fox
Bought by
Castellanos Oscar and Castellanos Francisco
Home Financials for this Owner
Home Financials are based on the most recent Mortgage that was taken out on this home.
Original Mortgage
$142,500
Interest Rate
10.45%
Mortgage Type
New Conventional
Purchase Details
Closed on
Nov 5, 1998
Sold by
Sedivy Constance
Bought by
Fox John A
Purchase Details
Closed on
Sep 25, 1998
Sold by
Fox Thomas L
Bought by
Fox John A
Create a Home Valuation Report for This Property
The Home Valuation Report is an in-depth analysis detailing your home's value as well as a comparison with similar homes in the area
Home Values in the Area
Average Home Value in this Area
Purchase History
| Date | Buyer | Sale Price | Title Company |
|---|---|---|---|
| Berg Holdings Inc | $31,000 | Attorneys Title Guaranty Fun | |
| Castellanos Oscar | $150,000 | First American Title | |
| Fox John A | -- | Ticor Title | |
| Fox John A | -- | Ticor Title |
Source: Public Records
Mortgage History
| Date | Status | Borrower | Loan Amount |
|---|---|---|---|
| Previous Owner | Castellanos Oscar | $142,500 |
Source: Public Records
Tax History Compared to Growth
Tax History
| Year | Tax Paid | Tax Assessment Tax Assessment Total Assessment is a certain percentage of the fair market value that is determined by local assessors to be the total taxable value of land and additions on the property. | Land | Improvement |
|---|---|---|---|---|
| 2024 | $3,308 | $62,415 | $9,977 | $52,438 |
| 2023 | $1,823 | $55,881 | $8,933 | $46,948 |
| 2022 | $3,923 | $40,127 | $7,736 | $32,391 |
| 2021 | $4,147 | $39,777 | $7,669 | $32,108 |
| 2020 | $4,201 | $37,057 | $7,145 | $29,912 |
| 2019 | $4,608 | $37,011 | $6,547 | $30,464 |
| 2018 | $3,676 | $28,435 | $7,722 | $20,713 |
| 2017 | $3,605 | $25,157 | $6,832 | $18,325 |
| 2016 | $3,378 | $24,425 | $5,937 | $18,488 |
| 2015 | $3,693 | $21,861 | $5,314 | $16,547 |
| 2014 | $2,686 | $15,876 | $4,703 | $11,173 |
| 2012 | $1,651 | $17,199 | $5,095 | $12,104 |
Source: Public Records
Map
Nearby Homes
- 132 Dorchester Ct
- 1416 Hamilton Ct
- 49 S Lewis Ave
- 2115 Lydia St
- 1521 Catalpa Ave
- 615 Tiffany Dr
- 1213 Grand Ave
- 0 Brookside Ave
- 23 N Jackson St
- 824 N Butrick St
- 24 Washington Terrace
- 28 N Saint James St
- 12601 W Atlantic Ave
- 2116 & 2101 Williamsburg Dr
- 511 Chestnut St
- 428 N Poplar St
- 1109 Massena Ave
- 613 Washington St
- 968 Judge Ave
- 522 N Poplar St
- 1820 Jenkinson Ct
- 1814 Jenkinson Ct
- 203 N Lewis Ave
- 1810 Jenkinson Ct
- 207 N Lewis Ave
- 1806 Jenkinson Ct
- 212 N Elmwood Ave
- 120 N Elmwood Ave
- 1817 Jenkinson Ct
- 1821 Jenkinson Ct
- 118 N Elmwood Ave
- 1734 Jenkinson Ct
- 116 N Elmwood Ave
- 1818 W Monroe St
- 111 N Lewis Ave
- 1802 W Monroe St
- 1730 Jenkinson Ct
- 213 N Elmwood Ave
- 112 N Elmwood Ave