P
Seller's Agent in 2021
Patsy Martin
Coldwell Banker Walden & Kirkland
(229) 343-8197
6 in this area
64 Total Sales
Estimated Value: $203,000 - $217,000
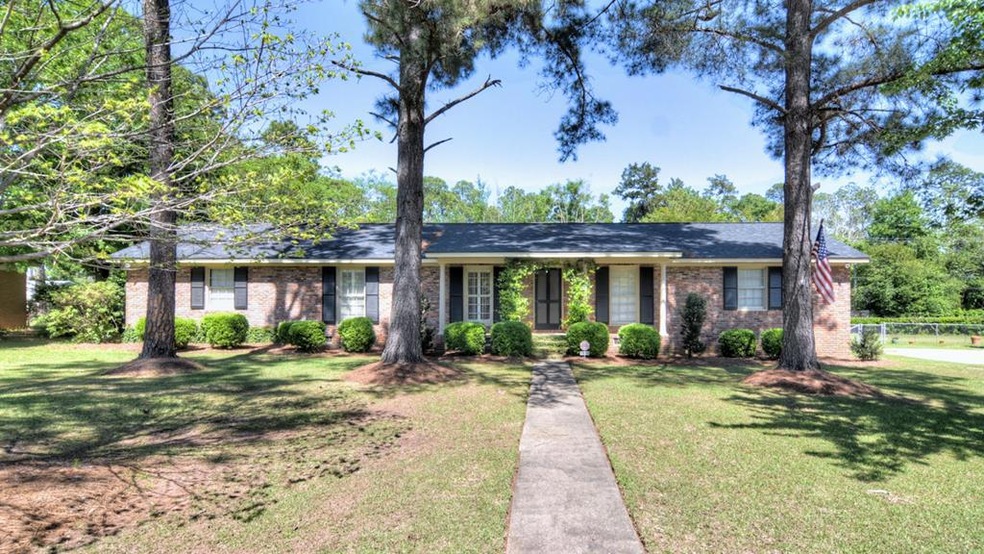
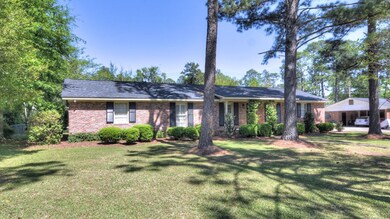
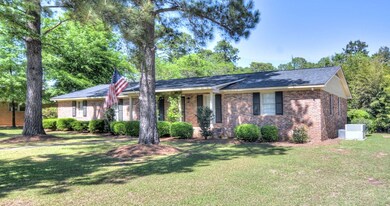
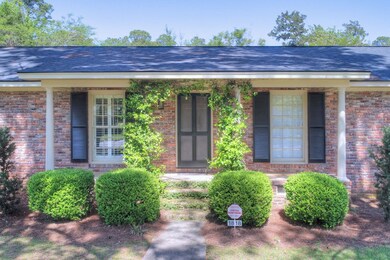
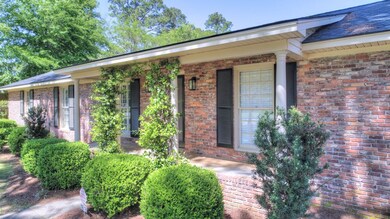
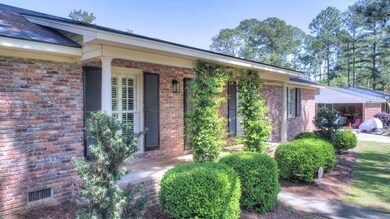
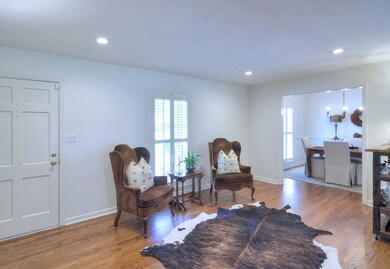
Just listed!!! Charm with a capital "See"! . This adorable , open home in Lake Park School District, with fabulous updates throughout , has everything you could possible want! The wall between the living and den has been removed for a wide open feeling throughout the home. Home has hardwoods throughout. All new lighting and light fixtures....Home has been painted inside and out. This 3 BR, 2 BA home has a kitchen with granite counters, new stainless appliances, and back splashes, updated cabinetry, etc.Home is wired for surround sound. The master bath has been completely gutted and has an awesome new shower, tiled floor and other beautiful fixtures. You won't break the bank buying this totally updated, charming home.
Last Agent to Sell the Property
Coldwell Banker Walden & Kirkland Brokerage Phone: 2294368811 License #40270 Listed on: 04/18/2021

| Date | Buyer | Sale Price | Title Company |
|---|---|---|---|
| Stokes Davonta | $162,000 | -- | |
| Evers Carolyn | $126,500 | -- | |
| Sadler Hazen H | $105,000 | -- | |
| Sweat Nan | -- | -- | |
| Cox Tyrone R Etal | -- | -- |
| Date | Status | Borrower | Loan Amount |
|---|---|---|---|
| Open | Stokes Davonta | $159,065 | |
| Previous Owner | Evers Carolyn | $124,208 |
| Date | Event | Price | List to Sale | Price per Sq Ft | Prior Sale |
|---|---|---|---|---|---|
| 05/26/2021 05/26/21 | Sold | $162,000 | +28.1% | $104 / Sq Ft | |
| 04/18/2021 04/18/21 | Pending | -- | -- | -- | |
| 05/31/2019 05/31/19 | Sold | $126,500 | -- | $81 / Sq Ft | View Prior Sale |
| 04/25/2019 04/25/19 | Pending | -- | -- | -- |
| Year | Tax Paid | Tax Assessment Tax Assessment Total Assessment is a certain percentage of the fair market value that is determined by local assessors to be the total taxable value of land and additions on the property. | Land | Improvement |
|---|---|---|---|---|
| 2024 | $2,315 | $48,520 | $9,000 | $39,520 |
| 2023 | $2,261 | $48,520 | $9,000 | $39,520 |
| 2022 | $2,269 | $48,520 | $9,000 | $39,520 |
| 2021 | $1,873 | $43,200 | $9,000 | $34,200 |
| 2020 | $1,877 | $43,200 | $9,000 | $34,200 |
| 2019 | $1,884 | $43,200 | $9,000 | $34,200 |
| 2018 | $1,892 | $43,200 | $9,000 | $34,200 |
| 2017 | $1,763 | $43,200 | $9,000 | $34,200 |
| 2016 | $1,764 | $43,200 | $9,000 | $34,200 |
| 2015 | $1,769 | $43,200 | $9,000 | $34,200 |
| 2014 | $1,747 | $43,200 | $9,000 | $34,200 |
P
Seller's Agent in 2021
Patsy Martin
Coldwell Banker Walden & Kirkland
(229) 343-8197
6 in this area
64 Total Sales
J
Buyer's Agent in 2021
Jarrett Tennyson
Coldwell Banker Walden & Kirkland
(229) 344-6183
1 in this area
30 Total Sales
Seller's Agent in 2019
Malinda Pollock
Coldwell Banker Walden & Kirkland
(229) 869-2282
13 in this area
136 Total Sales
Source: Albany Board of REALTORS®
MLS Number: 147362
APN: 000PP-00010-029