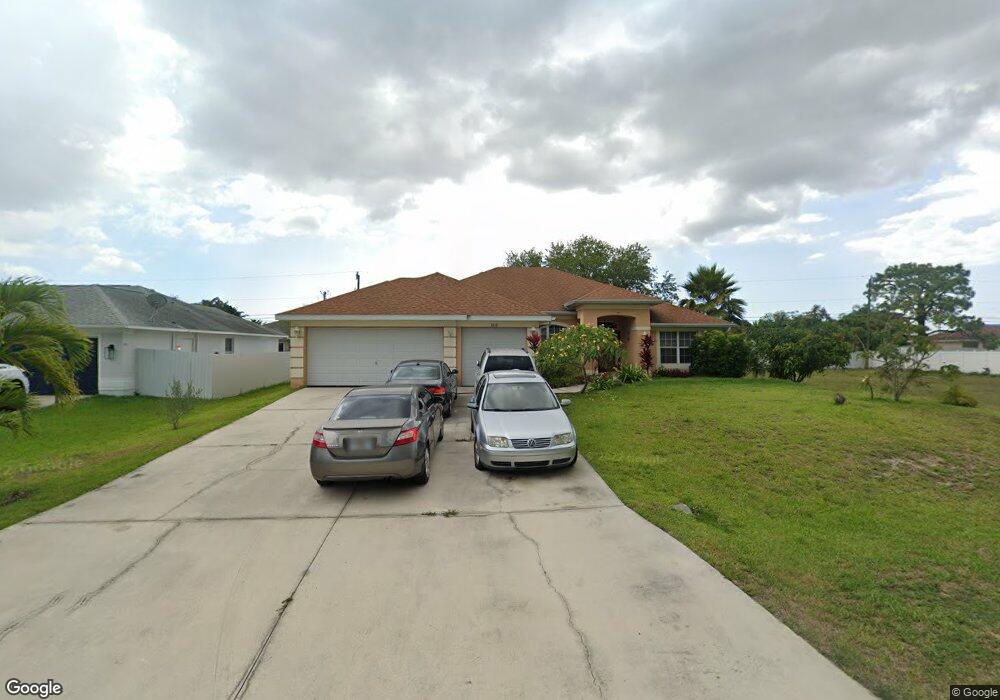
1818 NE 17th Place Unit 33 Cape Coral, FL 33909
Diplomat NeighborhoodEstimated Value: $312,098 - $442,000
4
Beds
3
Baths
2,443
Sq Ft
$155/Sq Ft
Est. Value
About This Home
This home is located at 1818 NE 17th Place Unit 33, Cape Coral, FL 33909 and is currently estimated at $378,275, approximately $154 per square foot. 1818 NE 17th Place Unit 33 is a home located in Lee County with nearby schools including Dr. Carrie D. Robinson Littleton Elementary School, Caloosa Elementary School, and Tropic Isles Elementary School.
Ownership History
Date
Name
Owned For
Owner Type
Purchase Details
Closed on
Feb 25, 2011
Sold by
Noboa Arlene
Bought by
Munir Majid and Munir Virginia
Current Estimated Value
Home Financials for this Owner
Home Financials are based on the most recent Mortgage that was taken out on this home.
Original Mortgage
$112,084
Outstanding Balance
$76,587
Interest Rate
4.75%
Mortgage Type
FHA
Estimated Equity
$301,688
Purchase Details
Closed on
Jan 28, 2010
Sold by
Maldonado Ubaldo
Bought by
Noboa Arlene
Purchase Details
Closed on
Dec 14, 2006
Sold by
Adams Homes Of Northwest Florida Inc
Bought by
Sanchez Ubaldo Maldonado and Noboa Arlene
Home Financials for this Owner
Home Financials are based on the most recent Mortgage that was taken out on this home.
Original Mortgage
$267,655
Interest Rate
6.29%
Mortgage Type
FHA
Purchase Details
Closed on
Dec 5, 2003
Sold by
Cooley Frederick and Cooley Margot
Bought by
Clobes James
Create a Home Valuation Report for This Property
The Home Valuation Report is an in-depth analysis detailing your home's value as well as a comparison with similar homes in the area
Home Values in the Area
Average Home Value in this Area
Purchase History
| Date | Buyer | Sale Price | Title Company |
|---|---|---|---|
| Munir Majid | $115,000 | Best Title Solutions Inc | |
| Noboa Arlene | -- | None Available | |
| Sanchez Ubaldo Maldonado | $272,000 | Tri County Title Insurance A | |
| Clobes James | $14,000 | -- |
Source: Public Records
Mortgage History
| Date | Status | Borrower | Loan Amount |
|---|---|---|---|
| Open | Munir Majid | $112,084 | |
| Previous Owner | Sanchez Ubaldo Maldonado | $267,655 |
Source: Public Records
Tax History Compared to Growth
Tax History
| Year | Tax Paid | Tax Assessment Tax Assessment Total Assessment is a certain percentage of the fair market value that is determined by local assessors to be the total taxable value of land and additions on the property. | Land | Improvement |
|---|---|---|---|---|
| 2025 | $3,174 | $190,884 | -- | -- |
| 2024 | $3,045 | $185,504 | -- | -- |
| 2023 | $3,045 | $180,101 | $0 | $0 |
| 2022 | $2,813 | $174,855 | $0 | $0 |
| 2021 | $2,841 | $211,016 | $7,700 | $203,316 |
| 2020 | $2,868 | $167,418 | $0 | $0 |
| 2019 | $2,777 | $163,654 | $0 | $0 |
| 2018 | $2,764 | $160,603 | $0 | $0 |
| 2017 | $2,745 | $157,300 | $0 | $0 |
| 2016 | $2,683 | $170,083 | $7,100 | $162,983 |
| 2015 | $2,694 | $152,994 | $6,500 | $146,494 |
| 2014 | $3,134 | $140,300 | $5,922 | $134,378 |
| 2013 | -- | $122,903 | $4,400 | $118,503 |
Source: Public Records
Map
Nearby Homes
- 1817 NE 17th Ave
- 1826 NE 17th Place
- 1815 NE 17th Place
- 1827 NE 17th Place
- 1922 NE 17th Place
- 1917 NE 17th Ave
- 1922 NE 17th Ave
- 1711 NE 17th Terrace
- 2213 Del Prado Blvd N
- 0 Del Prado Blvd N Unit C60/0C80 225019573
- 1727 NE 17th Terrace
- 3706 NE 17th Ave
- 1413 NE 17th Ave
- 1905 NE 18th Place
- 1706-1712 NE 17th St
- 1716 NE 16th Place
- 1820 NE 19th Ave
- 1923 NE 18th Place
- 1710 NE 16th Place
- 1627 NE 17th St
- 1814 NE 17th Place
- 1822 NE 17th Place
- 1817 NE 17th Ave Unit 9
- 1813 NE 17th Ave
- 1821 NE 17th Ave
- 1810 NE 17th Place
- 1819 NE 17th Place
- 1815 NE 17th Place Unit 8
- 1809 NE 17th Ave
- 1902 NE 17th Place Unit 41
- 1806 NE 17th Place
- 1901 NE 17th Ave
- 1805 NE 17th Ave
- 1807 NE 17th Place
- 1814 NE 17th Ave
- 1818 NE 18th Ave
- 1822 NE 17th Ave
- 1814 NE 18th Ave
- 1906 NE 17th Place
- 1903 NE 17th Place