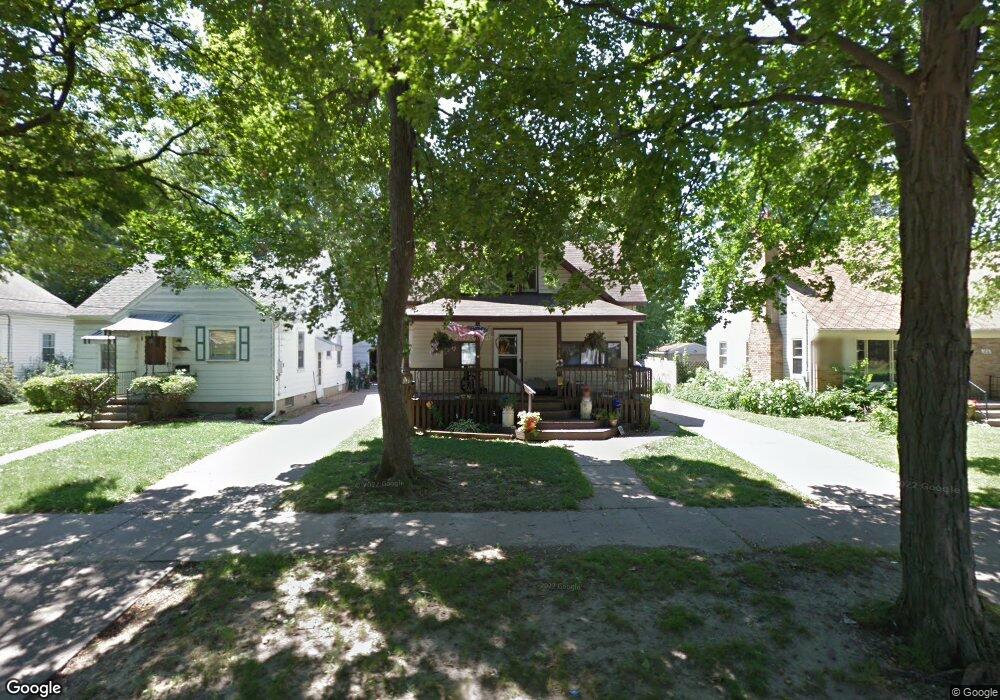
1818 Osband Ave Lansing, MI 48910
Moores Park NeighborhoodEstimated Value: $92,100 - $136,000
2
Beds
2
Baths
1,520
Sq Ft
$76/Sq Ft
Est. Value
About This Home
This home is located at 1818 Osband Ave, Lansing, MI 48910 and is currently estimated at $115,275, approximately $75 per square foot. 1818 Osband Ave is a home located in Ingham County with nearby schools including Averill Elementary School, Pattengill Academy, and J.W. Sexton High School.
Ownership History
Date
Name
Owned For
Owner Type
Purchase Details
Closed on
Sep 25, 2015
Sold by
Sheets David W
Bought by
D W Sheets I Llc
Current Estimated Value
Purchase Details
Closed on
Dec 30, 2011
Sold by
Sheets David W
Bought by
D W Sheets Iii Llc
Purchase Details
Closed on
Mar 12, 2009
Sold by
Simpson Kelly D
Bought by
Us Bank Na
Purchase Details
Closed on
Oct 19, 2006
Sold by
Simpson Kelly D
Bought by
U S Bank Na and Home Equity Asset Trust 2004-3 Home Equi
Purchase Details
Closed on
Aug 31, 1999
Sold by
Boynton David M and Boynton Dm
Bought by
Simpson Kelly D
Home Financials for this Owner
Home Financials are based on the most recent Mortgage that was taken out on this home.
Original Mortgage
$68,435
Interest Rate
7.93%
Mortgage Type
FHA
Purchase Details
Closed on
Sep 1, 1994
Create a Home Valuation Report for This Property
The Home Valuation Report is an in-depth analysis detailing your home's value as well as a comparison with similar homes in the area
Home Values in the Area
Average Home Value in this Area
Purchase History
| Date | Buyer | Sale Price | Title Company |
|---|---|---|---|
| D W Sheets I Llc | -- | None Available | |
| D W Sheets Iii Llc | -- | None Available | |
| Us Bank Na | $87,035 | None Available | |
| U S Bank Na | $82,441 | None Available | |
| Simpson Kelly D | $69,000 | -- | |
| -- | $49,000 | -- |
Source: Public Records
Mortgage History
| Date | Status | Borrower | Loan Amount |
|---|---|---|---|
| Previous Owner | Simpson Kelly D | $68,435 |
Source: Public Records
Tax History Compared to Growth
Tax History
| Year | Tax Paid | Tax Assessment Tax Assessment Total Assessment is a certain percentage of the fair market value that is determined by local assessors to be the total taxable value of land and additions on the property. | Land | Improvement |
|---|---|---|---|---|
| 2025 | $2,487 | $42,800 | $5,300 | $37,500 |
| 2024 | $20 | $43,800 | $5,300 | $38,500 |
| 2023 | $2,341 | $38,400 | $5,300 | $33,100 |
| 2022 | $2,139 | $36,700 | $7,600 | $29,100 |
| 2021 | $2,090 | $33,000 | $5,500 | $27,500 |
| 2020 | $2,075 | $31,800 | $5,500 | $26,300 |
| 2019 | $2,003 | $29,100 | $5,500 | $23,600 |
| 2018 | $1,901 | $25,700 | $5,500 | $20,200 |
| 2017 | $1,829 | $25,700 | $5,500 | $20,200 |
| 2016 | $1,756 | $25,300 | $5,500 | $19,800 |
| 2015 | $1,756 | $24,300 | $10,905 | $13,395 |
| 2014 | $1,756 | $23,100 | $6,164 | $16,936 |
Source: Public Records
Map
Nearby Homes
- 1836 Osband Ave
- 511 W Mount Hope Ave
- 1723 Osband Ave
- 712 Lenore Ave
- 2011 Osband Ave
- 1708 Beal Ave
- 907 Lenore Ave
- 1913 Stirling Ave
- 917 W Barnes Ave
- 1721 Fletcher St
- 2313 S Rundle Ave
- 2112 Stirling Ave
- 1010 W Barnes Ave
- 815 Woodbine Ave
- 2310 Stirling Ave
- 1114 Goodrich St
- 1116 George St
- 1722 S Washington Ave
- 2421 Stirling Ave
- 139 Woodlawn Ave