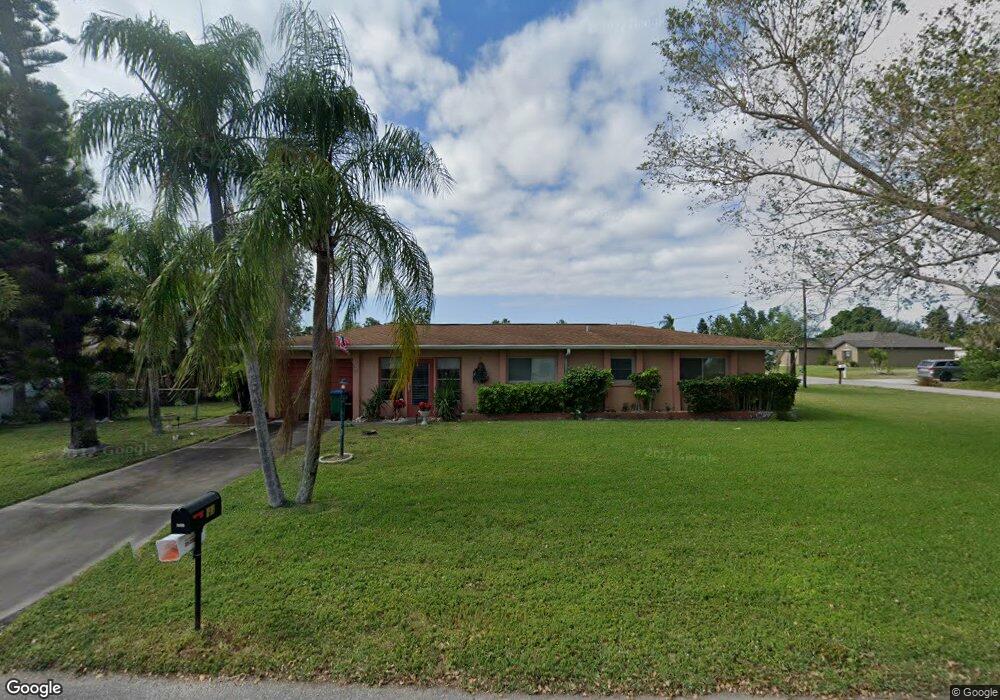
1818 SE 12th Place Cape Coral, FL 33990
Hancock NeighborhoodEstimated Value: $247,923 - $270,000
2
Beds
2
Baths
1,370
Sq Ft
$187/Sq Ft
Est. Value
About This Home
This home is located at 1818 SE 12th Place, Cape Coral, FL 33990 and is currently estimated at $255,981, approximately $186 per square foot. 1818 SE 12th Place is a home located in Lee County with nearby schools including Caloosa Elementary School, Cape Elementary School, and Tropic Isles Elementary School.
Ownership History
Date
Name
Owned For
Owner Type
Purchase Details
Closed on
Aug 29, 2006
Sold by
Bostock C Irving and Branczyk Robert J
Bought by
Bostock C Irving and Branczyk Robert J
Current Estimated Value
Purchase Details
Closed on
Mar 23, 2001
Sold by
Isler Dorothy M and Walsh Michael
Bought by
Branczyk Robert S and Irving Bostock C
Home Financials for this Owner
Home Financials are based on the most recent Mortgage that was taken out on this home.
Original Mortgage
$20,000
Outstanding Balance
$7,332
Interest Rate
7.11%
Estimated Equity
$248,649
Purchase Details
Closed on
Sep 19, 2000
Sold by
Isler Dorothy M and Isler Adron
Bought by
Isler Dorothy M and Walsh Michael
Purchase Details
Closed on
Sep 11, 1998
Sold by
Ross Dolly F
Bought by
Isler Aaron and Isler Dotti
Home Financials for this Owner
Home Financials are based on the most recent Mortgage that was taken out on this home.
Original Mortgage
$51,900
Interest Rate
6.92%
Create a Home Valuation Report for This Property
The Home Valuation Report is an in-depth analysis detailing your home's value as well as a comparison with similar homes in the area
Home Values in the Area
Average Home Value in this Area
Purchase History
| Date | Buyer | Sale Price | Title Company |
|---|---|---|---|
| Bostock C Irving | -- | Attorney | |
| Branczyk Robert S | -- | -- | |
| Branczyk Robert S | $71,000 | -- | |
| Isler Dorothy M | -- | -- | |
| Isler Aaron | $64,900 | -- |
Source: Public Records
Mortgage History
| Date | Status | Borrower | Loan Amount |
|---|---|---|---|
| Open | Branczyk Robert S | $20,000 | |
| Closed | Branczyk Robert S | $20,000 | |
| Previous Owner | Isler Aaron | $51,900 |
Source: Public Records
Tax History Compared to Growth
Tax History
| Year | Tax Paid | Tax Assessment Tax Assessment Total Assessment is a certain percentage of the fair market value that is determined by local assessors to be the total taxable value of land and additions on the property. | Land | Improvement |
|---|---|---|---|---|
| 2025 | $1,270 | $56,404 | -- | -- |
| 2024 | $1,183 | $54,814 | -- | -- |
| 2023 | $1,183 | $53,217 | $0 | $0 |
| 2022 | $1,038 | $51,667 | $0 | $0 |
| 2021 | $982 | $126,259 | $32,635 | $93,624 |
| 2020 | $970 | $49,469 | $0 | $0 |
| 2019 | $928 | $48,357 | $0 | $0 |
| 2018 | $903 | $47,455 | $0 | $0 |
| 2017 | $867 | $46,479 | $0 | $0 |
| 2016 | $826 | $87,843 | $17,816 | $70,027 |
| 2015 | $794 | $72,902 | $14,728 | $58,174 |
| 2014 | -- | $74,101 | $12,050 | $62,051 |
| 2013 | -- | $61,201 | $11,448 | $49,753 |
Source: Public Records
Map
Nearby Homes
- 1207 SE 18th Terrace
- 1122 SE 19th St
- 1222 SE 18th Terrace
- 1103 SE 18th St
- 1220 SE 19th Ln
- 1105 SE 17th Terrace
- 1725 SE 10th Place
- 1411 SE 18th Terrace
- 1927 SE 10th Place
- 1910 SE 10th Place
- 1002 SE 17th St
- 1922 SE 10th Place
- 1104 SE 16th Terrace
- 1903 SE 10th Ave
- 1202 SE 21st St
- 1405 SE 17th St
- 1927 SE 10th Ave
- 1215 SE 16th St
- 1439 SE 18th St
- 911 SE 18th Terrace
- 1122 SE 18th Terrace
- 1127 SE 19th St
- 1202 SE 18th Terrace
- 1123 SE 19th St
- 1118 SE 18th Terrace
- 1125 SE 18th Terrace
- 1203 SE 19th St
- 1129 SE 18th Terrace
- 1121 SE 18th Terrace
- 1119 SE 19th St
- 1206 SE 18th Terrace
- 1117 SE 18th Terrace
- 1203 SE 18th Terrace
- 1114 SE 18th Terrace
- 1115 SE 19th St
- 1209 SE 19th St
- 1113 SE 18th Terrace
- 1142 SE 18th St
- 1210 SE 18th Terrace
- 1126 SE 19th St