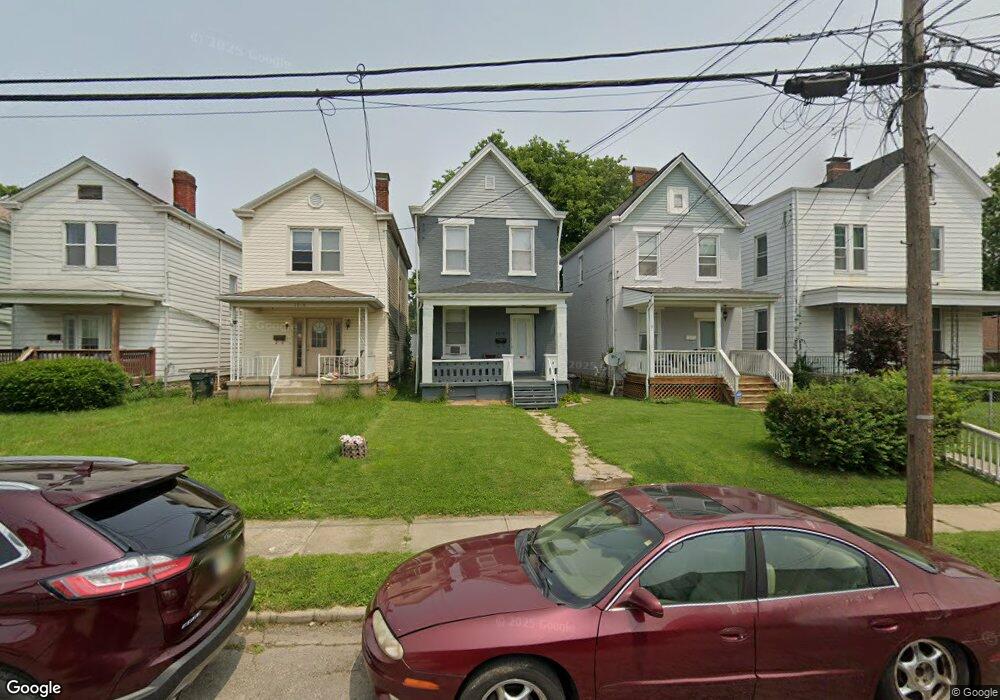
1818 Wayland Ave Cincinnati, OH 45212
Estimated Value: $190,224 - $229,000
3
Beds
2
Baths
1,088
Sq Ft
$195/Sq Ft
Est. Value
About This Home
This home is located at 1818 Wayland Ave, Cincinnati, OH 45212 and is currently estimated at $212,056, approximately $194 per square foot. 1818 Wayland Ave is a home located in Hamilton County with nearby schools including Norwood High School, Alliance Academy of Cincinnati, and Cornerstone Christian Academy.
Ownership History
Date
Name
Owned For
Owner Type
Purchase Details
Closed on
Dec 30, 2021
Sold by
Cinninnati Capital Holdinings Llc
Bought by
Grand Alpine Cch Llc
Current Estimated Value
Purchase Details
Closed on
Apr 25, 2012
Sold by
Lowery C
Bought by
Cincinnati Capital Holdings Llc
Purchase Details
Closed on
Nov 16, 2007
Sold by
Kimble Deana E
Bought by
Lowery C and 1818 Wayland Ave Land Trust
Purchase Details
Closed on
Feb 6, 2004
Sold by
Carroll Paige
Bought by
Kimble Deana E and Trust #4093950 Land Trust
Purchase Details
Closed on
Jun 29, 2001
Sold by
Bank One Na
Bought by
Carroll Paige
Purchase Details
Closed on
Dec 6, 2000
Sold by
Hurley James W and Hurley Jane
Bought by
Bank One Na
Purchase Details
Closed on
Oct 4, 1994
Sold by
Hurley Virginia L
Bought by
Hurley James W
Create a Home Valuation Report for This Property
The Home Valuation Report is an in-depth analysis detailing your home's value as well as a comparison with similar homes in the area
Home Values in the Area
Average Home Value in this Area
Purchase History
| Date | Buyer | Sale Price | Title Company |
|---|---|---|---|
| Grand Alpine Cch Llc | $2,000 | Parkway Title | |
| Cincinnati Capital Holdings Llc | -- | Attorney | |
| Lowery C | -- | None Available | |
| Kimble Deana E | -- | First Assurance Title Agency | |
| Kimble Deana E | -- | -- | |
| Carroll Paige | $39,900 | -- | |
| Bank One Na | $44,000 | -- | |
| Hurley James W | -- | -- |
Source: Public Records
Tax History Compared to Growth
Tax History
| Year | Tax Paid | Tax Assessment Tax Assessment Total Assessment is a certain percentage of the fair market value that is determined by local assessors to be the total taxable value of land and additions on the property. | Land | Improvement |
|---|---|---|---|---|
| 2024 | $2,226 | $41,780 | $6,388 | $35,392 |
| 2023 | $2,238 | $41,780 | $6,388 | $35,392 |
| 2022 | $1,018 | $15,964 | $4,291 | $11,673 |
| 2021 | $1,007 | $15,964 | $4,291 | $11,673 |
| 2020 | $985 | $15,964 | $4,291 | $11,673 |
| 2019 | $940 | $14,001 | $3,763 | $10,238 |
| 2018 | $940 | $14,001 | $3,763 | $10,238 |
| 2017 | $901 | $14,001 | $3,763 | $10,238 |
| 2016 | $942 | $14,001 | $3,539 | $10,462 |
| 2015 | $1,362 | $22,936 | $3,539 | $19,397 |
| 2014 | $1,356 | $22,936 | $3,539 | $19,397 |
| 2013 | $1,427 | $24,399 | $3,763 | $20,636 |
Source: Public Records
Map
Nearby Homes
- 1806 Wayland Ave
- 1821 Williams Ave
- 1768 Williams Ave
- 1915 Waverly Ave
- 3935 Lindley Ave
- 4108 Ivanhoe Ave
- 3912 Lindley Ave
- 1833 Hopkins Ave
- 3810 Regent Ave
- 2119 Slane Ave
- 4205 Lowry Ave
- 2127 Slane Ave
- 4108 Montgomery Rd
- 2110 Cleneay Ave
- 3756 Regent Ave
- 3752 Regent Ave
- 3954 Spencer Ave
- 4049 Victory Pkwy
- 3620 Trimble Ave
- 2119 Cameron Ave
- 1820 Wayland Ave
- 1816 Wayland Ave
- 1814 Wayland Ave
- 1824 Wayland Ave
- 1812 Wayland Ave
- 1810 Wayland Ave
- 1808 Wayland Ave
- 1834 Wayland Ave
- 1821 Mentor Ave
- 1804 Wayland Ave
- 1823 Mentor Ave
- 3909 Ivanhoe Ave
- 1802 Wayland Ave
- 1836 Wayland Ave
- 1825 Mentor Ave
- 3911 Ivanhoe Ave
- 1800 Wayland Ave
- 1831 Mentor Ave
- 1820 Mentor Ave
- 1810 Mentor Ave