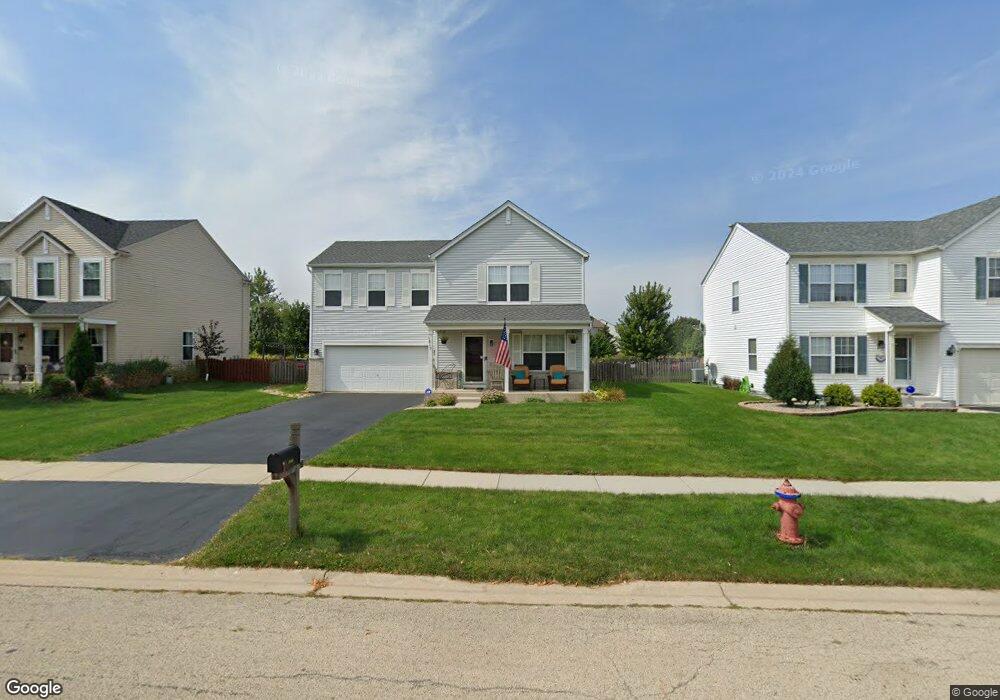
1819 Black Hill Ridge Dr Unit 3 Plainfield, IL 60586
Fall Creek NeighborhoodEstimated Value: $342,803 - $362,000
3
Beds
2
Baths
1,572
Sq Ft
$224/Sq Ft
Est. Value
About This Home
This home is located at 1819 Black Hill Ridge Dr Unit 3, Plainfield, IL 60586 and is currently estimated at $351,701, approximately $223 per square foot. 1819 Black Hill Ridge Dr Unit 3 is a home located in Will County with nearby schools including Ridge Elementary School, Drauden Point Middle School, and Plainfield South High School.
Ownership History
Date
Name
Owned For
Owner Type
Purchase Details
Closed on
Jun 12, 2017
Sold by
Rittenhouse Alana and Marino Donald
Bought by
Mcgahan Timothy R
Current Estimated Value
Home Financials for this Owner
Home Financials are based on the most recent Mortgage that was taken out on this home.
Original Mortgage
$165,600
Outstanding Balance
$137,480
Interest Rate
3.95%
Mortgage Type
New Conventional
Estimated Equity
$214,221
Purchase Details
Closed on
Apr 16, 2003
Sold by
Neumann Homes Inc
Bought by
Rittenhouse Alana and Marino Donald
Home Financials for this Owner
Home Financials are based on the most recent Mortgage that was taken out on this home.
Original Mortgage
$168,314
Interest Rate
5.86%
Mortgage Type
FHA
Create a Home Valuation Report for This Property
The Home Valuation Report is an in-depth analysis detailing your home's value as well as a comparison with similar homes in the area
Home Values in the Area
Average Home Value in this Area
Purchase History
| Date | Buyer | Sale Price | Title Company |
|---|---|---|---|
| Mcgahan Timothy R | $207,000 | First American Title | |
| Rittenhouse Alana | $171,000 | Chicago Title Insurance Co |
Source: Public Records
Mortgage History
| Date | Status | Borrower | Loan Amount |
|---|---|---|---|
| Open | Mcgahan Timothy R | $165,600 | |
| Previous Owner | Rittenhouse Alana | $168,314 |
Source: Public Records
Tax History Compared to Growth
Tax History
| Year | Tax Paid | Tax Assessment Tax Assessment Total Assessment is a certain percentage of the fair market value that is determined by local assessors to be the total taxable value of land and additions on the property. | Land | Improvement |
|---|---|---|---|---|
| 2024 | $6,049 | $92,233 | $24,187 | $68,046 |
| 2023 | $6,049 | $83,303 | $21,845 | $61,458 |
| 2022 | $5,404 | $74,817 | $19,620 | $55,197 |
| 2021 | $5,116 | $69,922 | $18,336 | $51,586 |
| 2020 | $5,035 | $67,938 | $17,816 | $50,122 |
| 2019 | $4,854 | $64,734 | $16,976 | $47,758 |
| 2018 | $4,638 | $60,821 | $15,950 | $44,871 |
| 2017 | $4,493 | $57,798 | $15,157 | $42,641 |
| 2016 | $4,395 | $55,125 | $14,456 | $40,669 |
| 2015 | $3,981 | $51,639 | $13,542 | $38,097 |
| 2014 | $3,981 | $48,066 | $13,064 | $35,002 |
| 2013 | $3,981 | $48,066 | $13,064 | $35,002 |
Source: Public Records
Map
Nearby Homes
- 2015 Brunswick Dr
- 6407 Coyote Ridge Ct
- 2042 Legacy Pointe Blvd
- 2115 Stafford Ct Unit 3
- 1603 Valley Ridge Dr
- 6113 Oldcreek Ln
- 1810 Legacy Pointe Blvd
- 1514 Spring Oaks Dr
- 1805 Overland Dr
- 1804 Overland Dr
- 1814 Legacy Pointe Blvd
- 1812 Legacy Pointe Blvd
- 1808 Legacy Pointe Blvd
- 6304 Southridge Dr
- 1807 Overland Dr
- 1806 Overland Dr
- 1816 Overland Dr
- 1812 Overland Dr
- 1813 Overland Dr
- 1817 Overland Dr
- 1817 Black Hill Ridge Dr Unit 3
- 1821 Black Hill Ridge Dr Unit 3
- 1815 Black Hill Ridge Dr Unit 3
- 1901 Black Hill Ridge Dr Unit 3
- 6318 Colton Ridge Ct
- 1813 Black Hill Ridge Dr
- 1903 Black Hill Ridge Dr Unit 3
- 6319 Colton Ridge Ct Unit 3
- 1816 Silver Ridge Dr
- 6315 Dakota Ridge Ct
- 6316 Colton Ridge Ct
- 1814 Silver Ridge Dr
- 1818 Silver Ridge Dr
- 6317 Colton Ridge Ct
- 1905 Black Hill Ridge Dr Unit 3
- 1811 Black Hill Ridge Dr Unit 3
- 1812 Silver Ridge Dr
- 6313 Dakota Ridge Ct
- 6314 Colton Ridge Ct
- 6314 Black Hill Ridge Dr Unit 3