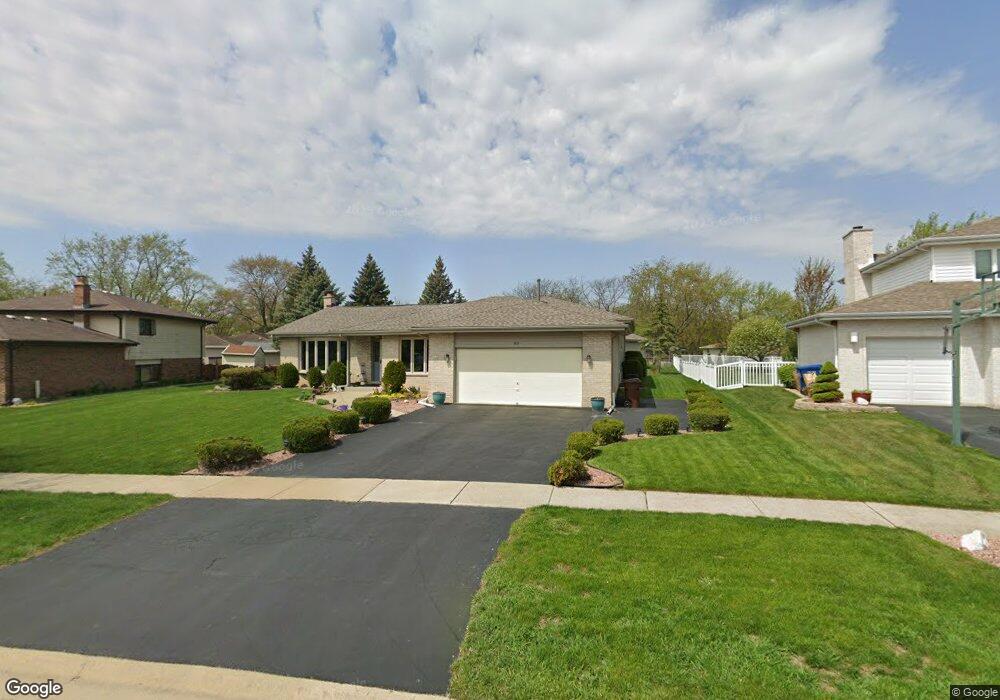
1819 Cornell Dr New Lenox, IL 60451
Estimated Value: $396,944 - $501,000
Studio
--
Bath
--
Sq Ft
0.31
Acres Lot
About This Home
This home is located at 1819 Cornell Dr, New Lenox, IL 60451 and is currently estimated at $441,986. 1819 Cornell Dr is a home located in Will County with nearby schools including Spencer Trail, Spencer Crossing Intermediate School, and Spencer Pointe.
Ownership History
Date
Name
Owned For
Owner Type
Purchase Details
Closed on
May 30, 2021
Sold by
Iraci Joseph A and Iraci Filippo A
Bought by
Iraci Filippo and Iraci Anne T
Current Estimated Value
Purchase Details
Closed on
Dec 22, 2020
Sold by
Iraci Filippo and Iraci Anne T
Bought by
Iraci Joseph A and Iraci Filippo A
Purchase Details
Closed on
Oct 24, 1997
Sold by
Huffman Mark and Huffman Judith S
Bought by
Iraci Filippo and Iraci Anne T
Home Financials for this Owner
Home Financials are based on the most recent Mortgage that was taken out on this home.
Original Mortgage
$70,000
Outstanding Balance
$11,306
Interest Rate
7.51%
Estimated Equity
$430,681
Purchase Details
Closed on
Jun 10, 1994
Sold by
First National Bank Of Evergreen Park
Bought by
Huffman Mark and Huffman Judith S
Home Financials for this Owner
Home Financials are based on the most recent Mortgage that was taken out on this home.
Original Mortgage
$164,600
Interest Rate
8.62%
Create a Home Valuation Report for This Property
The Home Valuation Report is an in-depth analysis detailing your home's value as well as a comparison with similar homes in the area
Home Values in the Area
Average Home Value in this Area
Purchase History
| Date | Buyer | Sale Price | Title Company |
|---|---|---|---|
| Iraci Filippo | -- | None Available | |
| Iraci Joseph A | -- | None Available | |
| Iraci Filippo | $195,000 | Chicago Title Insurance Co | |
| Huffman Mark | $187,500 | Chicago Title Insurance Co |
Source: Public Records
Mortgage History
| Date | Status | Borrower | Loan Amount |
|---|---|---|---|
| Open | Iraci Filippo | $70,000 | |
| Previous Owner | Huffman Mark | $164,600 |
Source: Public Records
Tax History
| Year | Tax Paid | Tax Assessment Tax Assessment Total Assessment is a certain percentage of the fair market value that is determined by local assessors to be the total taxable value of land and additions on the property. | Land | Improvement |
|---|---|---|---|---|
| 2024 | $7,348 | $126,871 | $36,393 | $90,478 |
| 2023 | $7,348 | $115,653 | $33,175 | $82,478 |
| 2022 | $8,267 | $106,544 | $30,562 | $75,982 |
| 2021 | $8,522 | $118,561 | $28,743 | $89,818 |
| 2020 | $7,585 | $114,330 | $27,717 | $86,613 |
| 2019 | $7,506 | $110,785 | $26,858 | $83,927 |
| 2018 | $7,612 | $106,966 | $25,932 | $81,034 |
| 2017 | $7,461 | $103,890 | $25,186 | $78,704 |
| 2016 | $7,455 | $101,110 | $24,512 | $76,598 |
| 2015 | $7,569 | $97,927 | $23,740 | $74,187 |
| 2014 | $7,569 | $96,718 | $23,447 | $73,271 |
| 2013 | $7,569 | $98,022 | $23,763 | $74,259 |
Source: Public Records
Map
Nearby Homes
- 931 Regent St
- 911 Somerset St
- 1351 E Lincoln Hwy
- 146 S Anderson Rd
- 836 Regent St
- 572 Bishops Gate
- 792 Downing St
- 1244 Georgias Way
- 1212 Georgias Way
- 1245 Georgias Way
- 455 S Marley Rd
- 1193 Georgias Way
- 732 Teal Dr Unit 1
- 2304 Riivendell Dr
- 753 Bon Terre Rd Unit 1
- 12650 Brighton Ct
- 2908 Northwind Dr
- 639 N Marley Rd
- 328 E Lincoln Hwy
- 19840 S Schoolhouse Rd
- 1827 Cornell Dr
- 1809 Cornell Dr
- 941 Regent St
- 1808 Cornell Dr
- 1839 Cornell Dr
- 222 Somerset Ct
- 226 Somerset Ct
- 1842 Cornell Dr Unit 2
- 601 Princeton Ln
- 218 Somerset Ct
- 1833 Regent St
- 602 Princeton Ln
- 948 Regent St
- 1862 Cornell Dr
- 1849 Regent St
- 236 Somerset Ct
- 225 Somerset Ct
- 1855 Cornell Dr
- 612 Princeton Ln
- 601 Dartmouth Ln
Your Personal Tour Guide
Ask me questions while you tour the home.