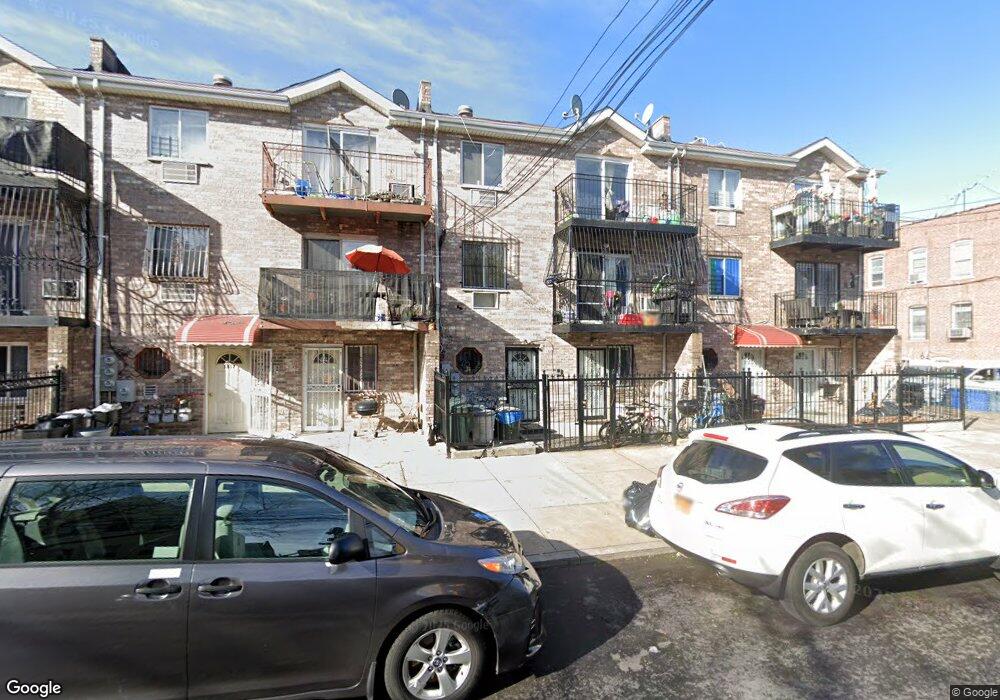
1819 Hunt Ave Bronx, NY 10462
Van Nest NeighborhoodEstimated Value: $1,014,000 - $1,217,000
Studio
--
Bath
3,240
Sq Ft
$348/Sq Ft
Est. Value
About This Home
This home is located at 1819 Hunt Ave, Bronx, NY 10462 and is currently estimated at $1,126,957, approximately $347 per square foot. 1819 Hunt Ave is a home located in Bronx County with nearby schools including P.S. 105 Senator Abraham Bernstein, Pelham Academy, and Bronx Green Middle School.
Ownership History
Date
Name
Owned For
Owner Type
Purchase Details
Closed on
Jun 23, 2022
Sold by
Ortiz Juan
Bought by
Ahad Maryam and Islam Kazirul
Current Estimated Value
Home Financials for this Owner
Home Financials are based on the most recent Mortgage that was taken out on this home.
Original Mortgage
$735,500
Outstanding Balance
$698,786
Interest Rate
5.1%
Mortgage Type
Purchase Money Mortgage
Estimated Equity
$428,171
Purchase Details
Closed on
Dec 21, 2001
Sold by
Bonano Edwin S and Bonano Sonia
Bought by
Samboy Richalson and Bonano Edwin S
Purchase Details
Closed on
Jul 19, 2001
Sold by
Morris P Hunt Associate
Bought by
Bonano Edwin S and Bonano Sonia
Home Financials for this Owner
Home Financials are based on the most recent Mortgage that was taken out on this home.
Original Mortgage
$364,500
Interest Rate
7.16%
Create a Home Valuation Report for This Property
The Home Valuation Report is an in-depth analysis detailing your home's value as well as a comparison with similar homes in the area
Home Values in the Area
Average Home Value in this Area
Purchase History
| Date | Buyer | Sale Price | Title Company |
|---|---|---|---|
| Ahad Maryam | $950,000 | -- | |
| Samboy Richalson | -- | -- | |
| Bonano Edwin S | -- | -- |
Source: Public Records
Mortgage History
| Date | Status | Borrower | Loan Amount |
|---|---|---|---|
| Open | Ahad Maryam | $735,500 | |
| Previous Owner | Bonano Edwin S | $364,500 |
Source: Public Records
Tax History
| Year | Tax Paid | Tax Assessment Tax Assessment Total Assessment is a certain percentage of the fair market value that is determined by local assessors to be the total taxable value of land and additions on the property. | Land | Improvement |
|---|---|---|---|---|
| 2025 | $8,434 | $43,718 | $6,642 | $37,076 |
| 2024 | $8,434 | $41,990 | $7,126 | $34,864 |
| 2023 | $8,247 | $40,608 | $7,970 | $32,638 |
| 2022 | $8,107 | $51,900 | $9,480 | $42,420 |
| 2021 | $8,127 | $48,900 | $9,480 | $39,420 |
| 2020 | $7,712 | $46,980 | $9,480 | $37,500 |
| 2019 | $7,320 | $37,860 | $9,480 | $28,380 |
| 2018 | $6,898 | $33,840 | $7,235 | $26,605 |
| 2017 | $6,898 | $33,840 | $7,933 | $25,907 |
| 2016 | $6,433 | $32,181 | $8,007 | $24,174 |
| 2015 | $4,031 | $30,360 | $10,500 | $19,860 |
| 2014 | $4,031 | $29,160 | $10,500 | $18,660 |
Source: Public Records
Map
Nearby Homes
- 1837 Victor St
- 733 Rhinelander Ave
- 1852 Amethyst St
- 1731 White Plains Rd
- 1858 Wallace Ave
- 1918 Hunt Ave
- 1827 Amethyst St
- 1823 Amethyst St
- 1914 Holland Ave
- 1721 White Plains Rd
- 1727 Victor St
- 679 van Nest Ave
- 1913 Barnes Ave
- 1839 Matthews Ave
- 760 van Nest Ave
- 1667 Hunt Ave
- 1916 Barnes Ave
- 1679 Unionport Rd
- 1677 Unionport Rd
- 1961 Wallace Ave
- 1817 Hunt Ave
- 1821 Hunt Ave
- 1815 Hunt Ave
- 1833 Hunt Ave
- 1813 Hunt Ave
- 1816 White Plains Rd
- 1811 Hunt Ave
- 1810 White Plains Rd
- 1835 Hunt Ave
- 1826 White Plains Rd
- 1818 Hunt Ave
- 1820 Hunt Ave Unit 2
- 1820 Hunt Ave Unit 1
- 1820 Hunt Ave
- 699-723 Morris Park Ave
- 1822 Hunt Ave
- 1816 Hunt Ave
- 1826 Hunt Ave
- 1839 Hunt Ave
- 1812 Hunt Ave
Your Personal Tour Guide
Ask me questions while you tour the home.