Estimated Value: $528,725 - $565,000
3
Beds
2
Baths
1,096
Sq Ft
$497/Sq Ft
Est. Value
About This Home
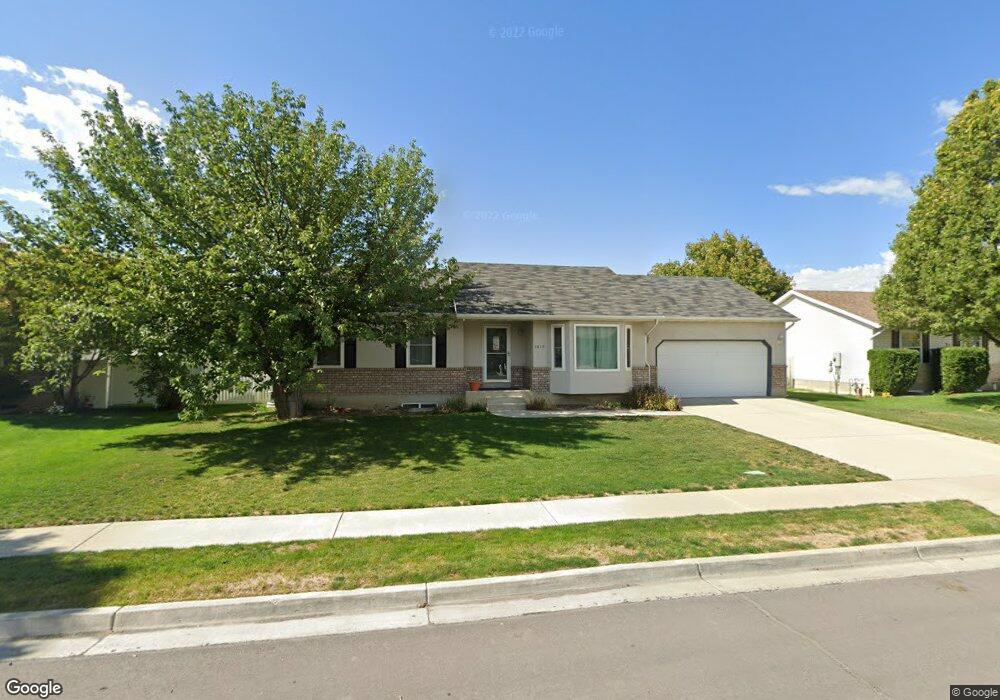
This home is located at 1819 N 900 E, Lehi, UT 84043 and is currently estimated at $544,908, approximately $497 per square foot. 1819 N 900 E is a home located in Utah County with nearby schools including Sego Lily Elementary School, Lehi Junior High School, and Skyridge High School.
Ownership History
Date
Name
Owned For
Owner Type
Purchase Details
Closed on
Mar 18, 2009
Sold by
Winterton Swayne S and Winterton Kristen T
Bought by
Winterton Swayne S and Winterton Kristen T
Current Estimated Value
Home Financials for this Owner
Home Financials are based on the most recent Mortgage that was taken out on this home.
Original Mortgage
$107,500
Interest Rate
5.19%
Mortgage Type
New Conventional
Purchase Details
Closed on
Nov 13, 2002
Sold by
Winterton Swayne S and Winterton Kristina T
Bought by
Winterton Swayne S and Winterton Kristen T
Home Financials for this Owner
Home Financials are based on the most recent Mortgage that was taken out on this home.
Original Mortgage
$125,500
Interest Rate
5.95%
Purchase Details
Closed on
Sep 22, 1998
Sold by
Patterson Construction Inc
Bought by
Winterton Swayne S and Winterton Kristin T
Home Financials for this Owner
Home Financials are based on the most recent Mortgage that was taken out on this home.
Original Mortgage
$130,150
Interest Rate
6.88%
Create a Home Valuation Report for This Property
The Home Valuation Report is an in-depth analysis detailing your home's value as well as a comparison with similar homes in the area
Home Values in the Area
Average Home Value in this Area
Purchase History
| Date | Buyer | Sale Price | Title Company |
|---|---|---|---|
| Winterton Swayne S | -- | Legacy Land Title Company | |
| Winterton Swayne S | -- | Paramount Title | |
| Winterton Swayne S | -- | First American |
Source: Public Records
Mortgage History
| Date | Status | Borrower | Loan Amount |
|---|---|---|---|
| Closed | Winterton Swayne S | $107,500 | |
| Closed | Winterton Swayne S | $125,500 | |
| Closed | Winterton Swayne S | $130,150 |
Source: Public Records
Tax History
| Year | Tax Paid | Tax Assessment Tax Assessment Total Assessment is a certain percentage of the fair market value that is determined by local assessors to be the total taxable value of land and additions on the property. | Land | Improvement |
|---|---|---|---|---|
| 2025 | $2,089 | $268,510 | -- | -- |
| 2024 | $2,089 | $244,420 | $0 | $0 |
| 2023 | $1,930 | $245,245 | $0 | $0 |
| 2022 | $2,115 | $260,535 | $0 | $0 |
| 2021 | $1,865 | $347,400 | $127,100 | $220,300 |
| 2020 | $1,758 | $323,600 | $117,700 | $205,900 |
| 2019 | $1,550 | $296,700 | $117,700 | $179,000 |
| 2018 | $1,503 | $272,000 | $112,600 | $159,400 |
| 2017 | $1,411 | $135,740 | $0 | $0 |
| 2016 | $1,356 | $121,000 | $0 | $0 |
| 2015 | $1,408 | $119,240 | $0 | $0 |
| 2014 | $1,351 | $113,740 | $0 | $0 |
Source: Public Records
Map
Nearby Homes
- 1370 N Cedar Hollow Blvd
- 1272 N Cedar Hollow Blvd
- 1175 E 900 N
- 4233 N 325 E Unit 1415
- 10365 N 6960 W
- 890 N Whipple Dr
- 6756 W 10050 N
- 832 N Somerset Aly
- 1329 N 100 E Unit 21
- 9967 N 6670 W
- 807 N Somerset Aly
- 9435 N Aspen Hollow Cir
- 2139 N Banbury Ct
- 893 N 1580 E
- 975 E 2850 N
- 6576 W 9810 N
- 356 W 1850 N Unit 6
- 1150 N 200 W Unit 6
- 878 E 3050 N
- 9932 N 6520 W Unit 40
Your Personal Tour Guide
Ask me questions while you tour the home.