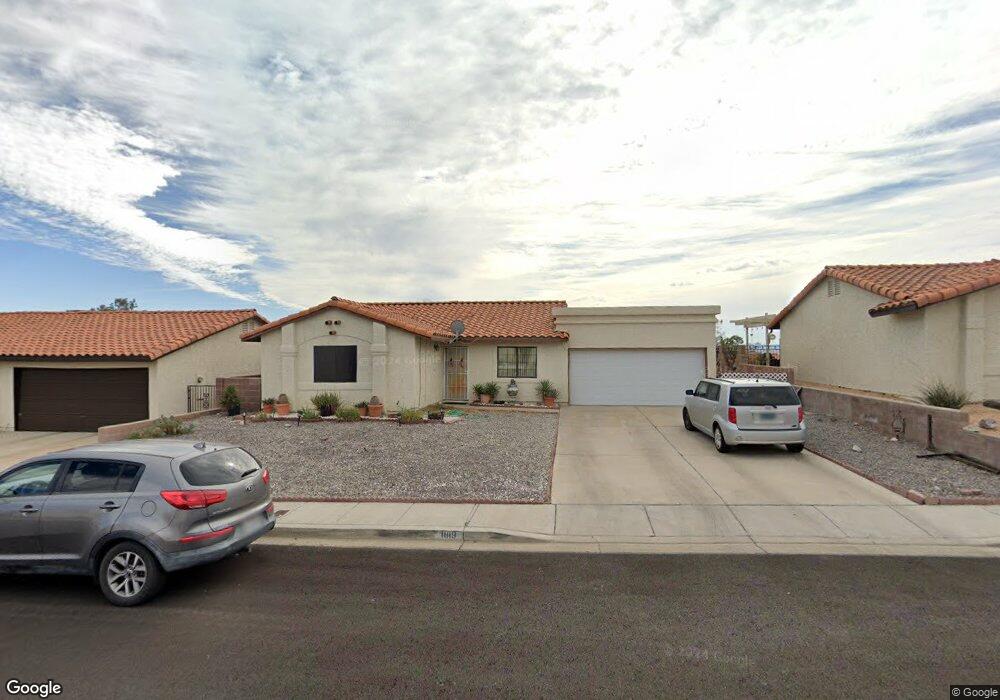
1819 Palmera Ct Laughlin, NV 89029
Estimated Value: $263,000 - $288,000
3
Beds
2
Baths
1,260
Sq Ft
$220/Sq Ft
Est. Value
About This Home
This home is located at 1819 Palmera Ct, Laughlin, NV 89029 and is currently estimated at $276,780, approximately $219 per square foot. 1819 Palmera Ct is a home located in Clark County with nearby schools including William G. Bennett Elementary School and Laughlin Junior/Senior High School.
Ownership History
Date
Name
Owned For
Owner Type
Purchase Details
Closed on
May 18, 2015
Sold by
Tardie Sharon L
Bought by
Patton Sheila and David Nelson
Current Estimated Value
Home Financials for this Owner
Home Financials are based on the most recent Mortgage that was taken out on this home.
Original Mortgage
$117,346
Outstanding Balance
$90,268
Interest Rate
3.64%
Mortgage Type
New Conventional
Estimated Equity
$186,512
Purchase Details
Closed on
Aug 23, 2012
Sold by
Duskin Shaorn L and Duskin Sharon L
Bought by
Tardie Sharon L and Sharon Tardie Revocable Trust
Purchase Details
Closed on
Dec 28, 1998
Sold by
Duskin Sharon L
Bought by
Duskin Sharon L
Purchase Details
Closed on
Nov 25, 1997
Sold by
Mintus Joseph A and Mintus Hazel L
Bought by
Duskin Sharon L
Home Financials for this Owner
Home Financials are based on the most recent Mortgage that was taken out on this home.
Original Mortgage
$66,750
Interest Rate
6.98%
Create a Home Valuation Report for This Property
The Home Valuation Report is an in-depth analysis detailing your home's value as well as a comparison with similar homes in the area
Home Values in the Area
Average Home Value in this Area
Purchase History
| Date | Buyer | Sale Price | Title Company |
|---|---|---|---|
| Patton Sheila | $115,000 | Chicago Title Las Vegas | |
| Tardie Sharon L | -- | None Available | |
| Duskin Sharon L | -- | -- | |
| Duskin Sharon L | $117,000 | First American Title Co |
Source: Public Records
Mortgage History
| Date | Status | Borrower | Loan Amount |
|---|---|---|---|
| Open | Patton Sheila | $117,346 | |
| Previous Owner | Duskin Sharon L | $66,750 |
Source: Public Records
Tax History Compared to Growth
Tax History
| Year | Tax Paid | Tax Assessment Tax Assessment Total Assessment is a certain percentage of the fair market value that is determined by local assessors to be the total taxable value of land and additions on the property. | Land | Improvement |
|---|---|---|---|---|
| 2025 | $1,271 | $49,929 | $12,600 | $37,329 |
| 2024 | $1,234 | $49,929 | $12,600 | $37,329 |
| 2023 | $1,006 | $56,937 | $21,000 | $35,937 |
| 2022 | $1,198 | $49,234 | $16,100 | $33,134 |
| 2021 | $1,163 | $46,097 | $14,350 | $31,747 |
| 2020 | $1,127 | $45,728 | $14,000 | $31,728 |
| 2019 | $1,095 | $43,126 | $11,550 | $31,576 |
| 2018 | $1,063 | $41,777 | $11,200 | $30,577 |
| 2017 | $1,370 | $40,916 | $9,800 | $31,116 |
| 2016 | $1,006 | $41,556 | $9,800 | $31,756 |
| 2015 | $1,004 | $37,472 | $8,750 | $28,722 |
| 2014 | $972 | $28,197 | $7,000 | $21,197 |
Source: Public Records
Map
Nearby Homes
- 1826 Dunes Ct
- 1851 Maricopa Dr
- 2822 La Palma Dr
- 1862 Maricopa Dr
- 2823 Biscaya Dr
- 1936 Las Palmas Ln Unit 185
- 1940 Las Palmas Ln Unit 272
- 1932 Las Palmas Ln Unit 283
- 3008 Soledad Dr
- 1948 Las Palmas Ln Unit 277
- 1928 Las Palmas Ln Unit 228
- 1952 Las Palmas Ln Unit 232
- 2888 Cattail Cove St
- 1964 Las Palmas Ln Unit 141
- 2847 Cattail Cove St
- 2078 Willow Bay Rd
- 2772 Brinkley Manor St
- 2905 Shimmering Bay St
- 2748 Brinkley Manor St
- 2077 Alki Beach Ave
- 1829 Palmera Ct
- 1809 Palmera Ct
- 1818 Oasis Ct
- 1808 Oasis Ct
- 1839 Palmera Ct
- 1828 Oasis Ct
- 1820 Palmera Ct
- 1830 Palmera Ct
- 1810 Palmera Ct
- 1849 Palmera Ct
- 1838 Oasis Ct
- 1840 Palmera Ct
- 2854 La Palma Dr
- 2862 La Palma Dr
- 2846 La Palma Dr
- 2870 La Palma Dr
- 1850 Palmera Ct
- 2838 La Palma Dr
- 1848 Oasis Ct
- 1817 Oasis Ct