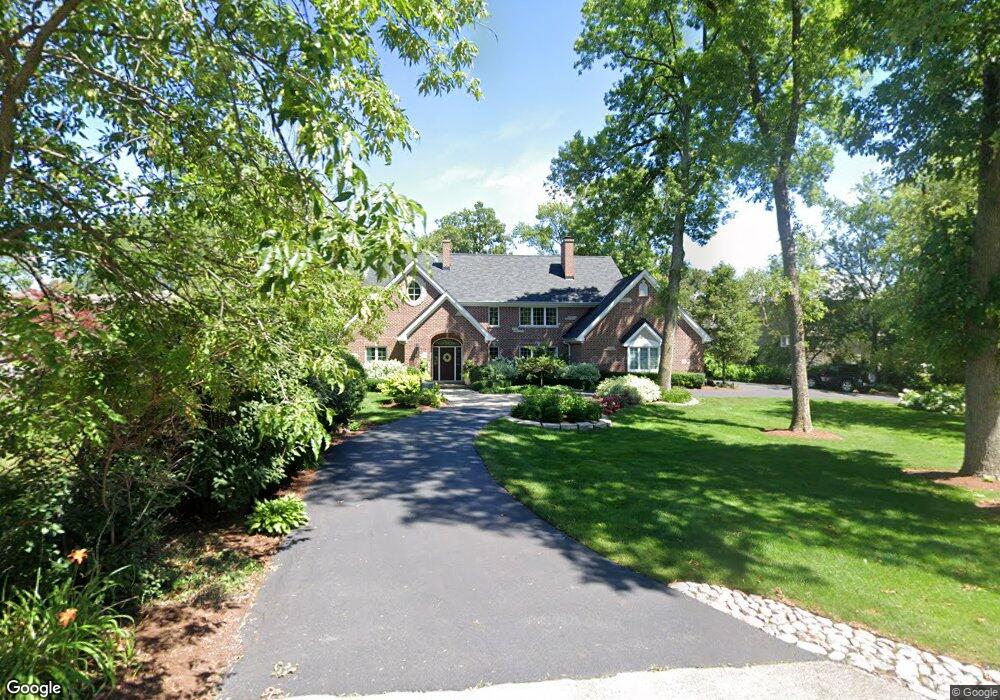
1819 Ridgewood Ln E Glenview, IL 60025
Estimated Value: $2,210,260 - $2,828,000
4
Beds
4
Baths
4,687
Sq Ft
$552/Sq Ft
Est. Value
About This Home
This home is located at 1819 Ridgewood Ln E, Glenview, IL 60025 and is currently estimated at $2,587,420, approximately $552 per square foot. 1819 Ridgewood Ln E is a home located in Cook County with nearby schools including Lyon Elementary School, Pleasant Ridge Elementary School, and Attea Middle School.
Ownership History
Date
Name
Owned For
Owner Type
Purchase Details
Closed on
Jan 7, 2002
Sold by
Vankirk Timothy S and Vankirk Julie
Bought by
Simons John N and Simons Jeanne L
Current Estimated Value
Home Financials for this Owner
Home Financials are based on the most recent Mortgage that was taken out on this home.
Original Mortgage
$250,000
Interest Rate
7.16%
Mortgage Type
Balloon
Purchase Details
Closed on
Jan 29, 1998
Sold by
Koepke F Kenneth and Koepke Marcia A
Bought by
Vankirk Timothy S and Vankirk Julie
Home Financials for this Owner
Home Financials are based on the most recent Mortgage that was taken out on this home.
Original Mortgage
$375,200
Interest Rate
6.05%
Create a Home Valuation Report for This Property
The Home Valuation Report is an in-depth analysis detailing your home's value as well as a comparison with similar homes in the area
Home Values in the Area
Average Home Value in this Area
Purchase History
| Date | Buyer | Sale Price | Title Company |
|---|---|---|---|
| Simons John N | $630,000 | -- | |
| Vankirk Timothy S | $469,000 | -- |
Source: Public Records
Mortgage History
| Date | Status | Borrower | Loan Amount |
|---|---|---|---|
| Closed | Simons John N | $250,000 | |
| Previous Owner | Vankirk Timothy S | $375,200 |
Source: Public Records
Tax History
| Year | Tax Paid | Tax Assessment Tax Assessment Total Assessment is a certain percentage of the fair market value that is determined by local assessors to be the total taxable value of land and additions on the property. | Land | Improvement |
|---|---|---|---|---|
| 2025 | $41,223 | $176,235 | $28,594 | $147,641 |
| 2024 | $41,223 | $186,000 | $23,828 | $162,172 |
| 2023 | $40,041 | $186,000 | $23,828 | $162,172 |
| 2022 | $40,041 | $186,000 | $23,828 | $162,172 |
| 2021 | $30,390 | $122,780 | $24,423 | $98,357 |
| 2020 | $30,078 | $122,780 | $24,423 | $98,357 |
| 2019 | $28,091 | $134,924 | $24,423 | $110,501 |
| 2018 | $29,887 | $129,722 | $21,445 | $108,277 |
| 2017 | $29,224 | $129,722 | $21,445 | $108,277 |
| 2016 | $27,871 | $129,722 | $21,445 | $108,277 |
| 2015 | $24,383 | $101,342 | $18,466 | $82,876 |
| 2014 | $23,823 | $101,342 | $18,466 | $82,876 |
| 2013 | $23,109 | $101,342 | $18,466 | $82,876 |
Source: Public Records
Map
Nearby Homes
- 1050 Burton Terrace
- 941 Burton Terrace
- 1427 Kenilworth Ln
- 1439 Pleasant Ln
- 1431 Meadow Ln
- 1443 Hawthorne Ln
- 1410 Tuscany Ct
- 1437 Sunset Ridge Rd
- 118 Dickens Rd
- 164 Wagner Rd
- 1571 Winnetka Rd Unit 1571
- 220 Sunset Ridge Rd
- 2033 Winnetka Rd
- 1774 Rogers Ave
- 265 Dickens St
- 1809 Jefferson Ave
- 1410 Pebblecreek Dr Unit 153
- 1855 Tanglewood Dr Unit F
- 1440 Elizabeth Ln
- 1720 Wildberry Dr Unit B
- 1777 Ridgewood Ln E
- 1845 Ridgewood Ln E
- 1049 Linden Ln
- 1840 Ridgewood Ln E
- 1114 Pleasant Ln
- 1040 Kenilworth Ln
- 1855 Ridgewood Ln E
- 1051 Linden Ln
- 1850 Ridgewood Ln E
- 1749 Ridgewood Ln E
- 1036 Kenilworth Ln
- 1047 Linden Ln
- 1140 Pleasant Ln
- 1028 Kenilworth Ln
- 1200 Pleasant Ln
- 1026 Kenilworth Ln
- 1115 Pleasant Ln
- 1857 Ridgewood Ln W
- 1925 Ridgewood Ln E
- 1920 Ridgewood Ln E
Your Personal Tour Guide
Ask me questions while you tour the home.