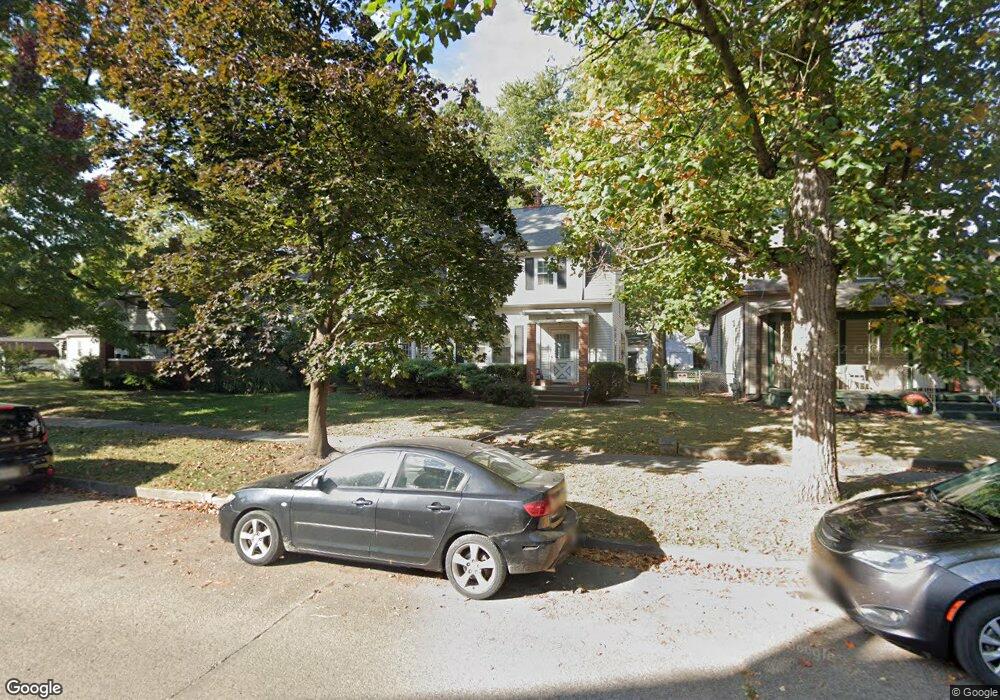
1819 S 6th St Terre Haute, IN 47802
Southland-Sarah Scott NeighborhoodEstimated Value: $122,000 - $144,000
2
Beds
1
Bath
2,018
Sq Ft
$66/Sq Ft
Est. Value
About This Home
This home is located at 1819 S 6th St, Terre Haute, IN 47802 and is currently estimated at $134,062, approximately $66 per square foot. 1819 S 6th St is a home located in Vigo County with nearby schools including Farrington Grove Elementary School, Sarah Scott Middle School, and Terre Haute South Vigo High School.
Ownership History
Date
Name
Owned For
Owner Type
Purchase Details
Closed on
Dec 16, 2005
Sold by
Bula Mathew and Bula Rita
Bought by
Ray Matthew J and Ray Amanda J
Current Estimated Value
Home Financials for this Owner
Home Financials are based on the most recent Mortgage that was taken out on this home.
Original Mortgage
$68,800
Outstanding Balance
$38,654
Interest Rate
6.36%
Mortgage Type
New Conventional
Estimated Equity
$95,408
Create a Home Valuation Report for This Property
The Home Valuation Report is an in-depth analysis detailing your home's value as well as a comparison with similar homes in the area
Home Values in the Area
Average Home Value in this Area
Purchase History
| Date | Buyer | Sale Price | Title Company |
|---|---|---|---|
| Ray Matthew J | -- | None Available |
Source: Public Records
Mortgage History
| Date | Status | Borrower | Loan Amount |
|---|---|---|---|
| Open | Ray Matthew J | $68,800 |
Source: Public Records
Tax History Compared to Growth
Tax History
| Year | Tax Paid | Tax Assessment Tax Assessment Total Assessment is a certain percentage of the fair market value that is determined by local assessors to be the total taxable value of land and additions on the property. | Land | Improvement |
|---|---|---|---|---|
| 2024 | $1,145 | $108,400 | $12,700 | $95,700 |
| 2023 | $1,101 | $103,700 | $12,700 | $91,000 |
| 2022 | $1,000 | $95,600 | $12,700 | $82,900 |
| 2021 | $917 | $88,000 | $12,500 | $75,500 |
| 2020 | $907 | $87,200 | $12,300 | $74,900 |
| 2019 | $888 | $85,600 | $12,100 | $73,500 |
| 2018 | $1,247 | $82,300 | $11,600 | $70,700 |
| 2017 | $810 | $80,200 | $11,500 | $68,700 |
| 2016 | $804 | $80,000 | $11,500 | $68,500 |
| 2014 | $736 | $76,900 | $10,300 | $66,600 |
| 2013 | $736 | $75,200 | $9,900 | $65,300 |
Source: Public Records
Map
Nearby Homes