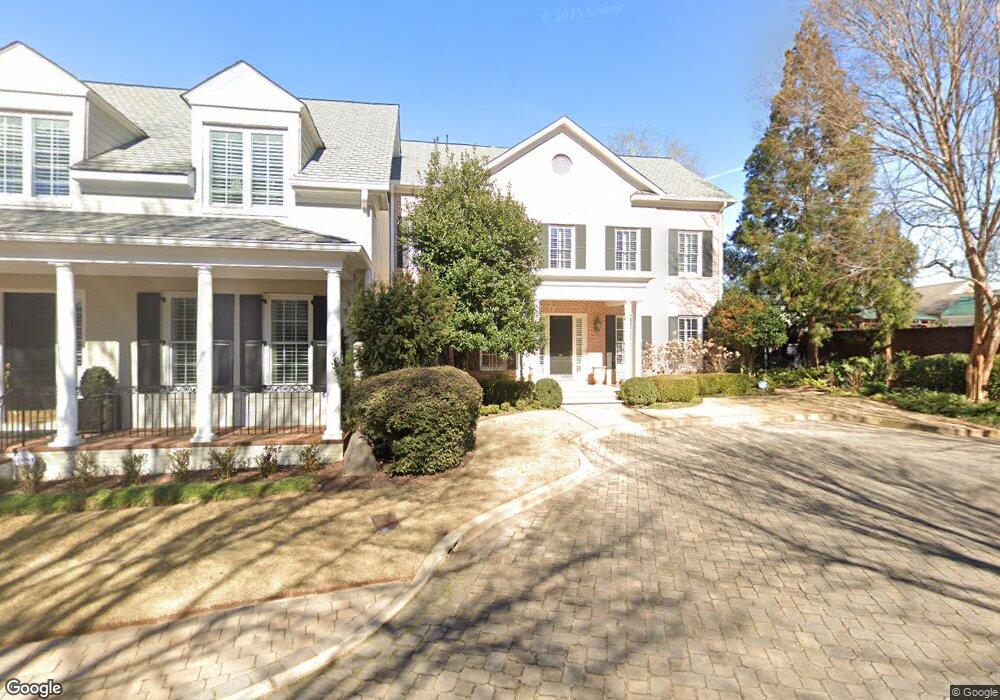
1819 S Lumpkin St Unit 2 Athens, GA 30606
Five Points NeighborhoodEstimated Value: $1,386,000 - $1,920,378
5
Beds
5
Baths
4,173
Sq Ft
$389/Sq Ft
Est. Value
About This Home
This home is located at 1819 S Lumpkin St Unit 2, Athens, GA 30606 and is currently estimated at $1,624,126, approximately $389 per square foot. 1819 S Lumpkin St Unit 2 is a home located in Clarke County with nearby schools including Barrow Elementary School, Clarke Middle School, and Clarke Central High School.
Ownership History
Date
Name
Owned For
Owner Type
Purchase Details
Closed on
Dec 7, 2018
Sold by
Morrow Bruce W
Bought by
Beard Payne William Porter and Beard Payne Martha
Current Estimated Value
Purchase Details
Closed on
May 24, 2006
Sold by
Not Provided
Bought by
Morrow Morrow Bruce W Bruce W and Morrow Cynthia P
Home Financials for this Owner
Home Financials are based on the most recent Mortgage that was taken out on this home.
Original Mortgage
$250,000
Interest Rate
6.5%
Mortgage Type
New Conventional
Purchase Details
Closed on
Aug 2, 2004
Sold by
Hatfield Larry L and Hatfield Carolyn W
Bought by
Scherffius Latrelle Moon
Purchase Details
Closed on
Aug 8, 2002
Sold by
Callaway William J
Bought by
Hatfield Larry L and Hatfie Carolyn W
Create a Home Valuation Report for This Property
The Home Valuation Report is an in-depth analysis detailing your home's value as well as a comparison with similar homes in the area
Home Values in the Area
Average Home Value in this Area
Purchase History
| Date | Buyer | Sale Price | Title Company |
|---|---|---|---|
| Beard Payne William Porter | $825,000 | -- | |
| Morrow Morrow Bruce W Bruce W | $590,000 | -- | |
| Scherffius Latrelle Moon | $650,000 | -- | |
| Hatfield Larry L | $560,000 | -- |
Source: Public Records
Mortgage History
| Date | Status | Borrower | Loan Amount |
|---|---|---|---|
| Previous Owner | Morrow Morrow Bruce W Bruce W | $250,000 |
Source: Public Records
Tax History Compared to Growth
Tax History
| Year | Tax Paid | Tax Assessment Tax Assessment Total Assessment is a certain percentage of the fair market value that is determined by local assessors to be the total taxable value of land and additions on the property. | Land | Improvement |
|---|---|---|---|---|
| 2025 | $19,655 | $633,026 | $54,000 | $579,026 |
| 2024 | $19,655 | $689,456 | $54,000 | $635,456 |
| 2023 | $12,904 | $412,940 | $48,600 | $364,340 |
| 2022 | $11,903 | $373,148 | $48,600 | $324,548 |
| 2021 | $11,667 | $346,201 | $48,600 | $297,601 |
| 2020 | $11,093 | $329,167 | $48,600 | $280,567 |
| 2019 | $11,118 | $327,486 | $48,600 | $278,886 |
| 2018 | $8,869 | $285,448 | $48,600 | $236,848 |
| 2017 | $8,869 | $285,448 | $48,600 | $236,848 |
| 2016 | $8,640 | $269,042 | $48,600 | $220,442 |
| 2015 | $8,546 | $261,341 | $45,000 | $216,341 |
| 2014 | $8,559 | $261,341 | $45,000 | $216,341 |
Source: Public Records
Map
Nearby Homes
- 2019 S Lumpkin St
- 275 Westview Dr
- 183 Parkway Dr
- 204 Gran Ellen Dr
- 1697 S Milledge Ave
- 221 University Dr
- 104 W Lake Ct
- 265 Annes Ct
- 685 Pinecrest Dr
- 115 Annes Ct
- 495 Woodlawn Ave
- 997 S Milledge Ave Unit 2
- 997 S Milledge Ave Unit 3
- 997 S Milledge Ave Unit 1
- 997 S Milledge Ave Unit 4
- 490 Ofarrell St
- 128 Habersham Dr
- 490 Mcwhorter Dr
- 760 E Campus Rd Unit 93
- 760 E Campus Rd Unit 95
- 1819 S Lumpkin St Unit 9
- 1819 S Lumpkin St Unit 7
- 1819 S Lumpkin St Unit U-9
- 1819 S Lumpkin St Unit 13
- 1819 S Lumpkin St Unit 15
- 1819 S Lumpkin St Unit 3
- 1819 S Lumpkin St Unit 14
- 1819 S Lumpkin St Unit 8
- 1819 S Lumpkin St Unit 1
- 1819 S Lumpkin St Unit 4
- 1819 S Lumpkin St Unit 5
- 1819 S Lumpkin St
- 1819 S Lumpkin St
- 1819 S Lumpkin St
- 1819 S Lumpkin St Unit 11
- 1819 S Lumpkin St
- 1819 S Lumpkin St
- 1819 S Lumpkin St
- 1819 S Lumpkin St
- 1819 S Lumpkin St