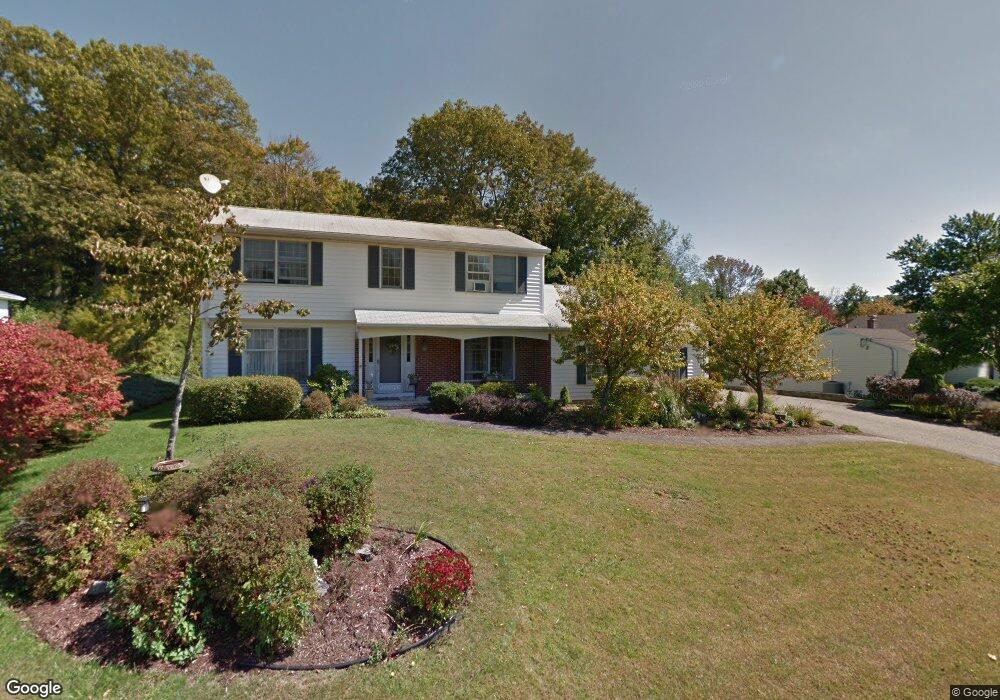
182 Allison Dr Torrington, CT 06790
Torrington AreaEstimated Value: $426,891 - $481,000
About This Home
This home is located at 182 Allison Dr, Torrington, CT 06790 and is currently estimated at $441,473, approximately $197 per square foot. 182 Allison Dr is a home located in Litchfield County with nearby schools including Torrington Middle School, Torrington High School, and Torrington Christian Academy.
Ownership History
We collect this data history from publicly available records. To have your information removed, we recommend requesting removal directly through your county’s website.
Purchase Details
Home Values in the Area
Average Home Value in this Area
Purchase History
We collect this data history from publicly available records. To have your information removed, we recommend requesting removal directly through your county’s website.
| Date | Buyer | Sale Price | Title Company |
|---|---|---|---|
| $250,000 | -- |
Mortgage History
We collect this data history from publicly available records. To have your information removed, we recommend requesting removal directly through your county’s website.
| Date | Status | Borrower | Loan Amount |
|---|---|---|---|
| Closed | $226,058 | ||
| Closed | $62,893 | ||
| Closed | $284,592 | ||
| Closed | $29,000 |
Tax History
We collect this data history from publicly available records. To have your information removed, we recommend requesting removal directly through your county’s website.
| Year | Tax Paid | Tax Assessment Tax Assessment Total Assessment is a certain percentage of the fair market value that is determined by local assessors to be the total taxable value of land and additions on the property. | Land | Improvement |
|---|---|---|---|---|
| 2025 | $9,461 | $246,050 | $30,520 | $215,530 |
| 2024 | $7,169 | $149,440 | $57,720 | $91,720 |
| 2023 | $7,167 | $149,440 | $57,720 | $91,720 |
| 2022 | $7,045 | $149,440 | $57,720 | $91,720 |
| 2021 | $6,900 | $149,440 | $57,720 | $91,720 |
| 2020 | $6,900 | $149,440 | $57,720 | $91,720 |
| 2019 | $6,052 | $131,070 | $34,630 | $96,440 |
| 2018 | $6,052 | $131,070 | $34,630 | $96,440 |
| 2017 | $5,996 | $131,070 | $34,630 | $96,440 |
| 2016 | $5,996 | $131,070 | $34,630 | $96,440 |
| 2015 | $5,996 | $131,070 | $34,630 | $96,440 |
| 2014 | $6,495 | $178,820 | $63,560 | $115,260 |
Map
- 1257 Torringford St
- 43 Windtree E
- 100 Silver Fox Ln
- 1435 Torringford St
- 185 Cider Mill Crossing
- 1448 Torringford St
- 142 Durand St
- 1517 Torringford St
- 172 Wedgewood Dr
- 1683 Torringford St
- 121 Wedgewood Dr
- 2495 Torringford West St
- 0 Torringford West St
- 977 Torringford East St
- 37 Augustyn Ct
- 68 Rockledge Loop
- 660 Torringford St
- 660 Torringford St
- 266 Albrecht Rd
- 57 Rockledge Loop Unit 57
Ask me questions while you tour the home.