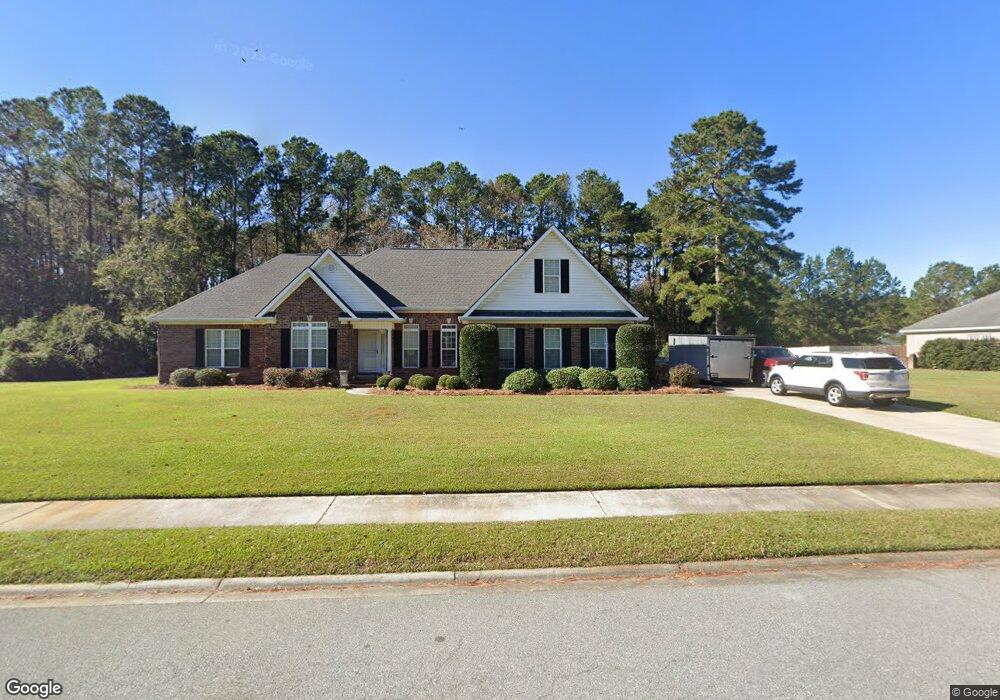
182 Brigham Dr Richmond Hill, GA 31324
Estimated Value: $444,000 - $526,000
4
Beds
3
Baths
2,236
Sq Ft
$213/Sq Ft
Est. Value
About This Home
This home is located at 182 Brigham Dr, Richmond Hill, GA 31324 and is currently estimated at $476,360, approximately $213 per square foot. 182 Brigham Dr is a home located in Bryan County with nearby schools including Frances Meeks Elementary School, Dr. George Washington Carver Elementary School, and Richmond Hill Elementary School.
Ownership History
Date
Name
Owned For
Owner Type
Purchase Details
Closed on
Aug 13, 2009
Sold by
Hsbc Mortgage Services Inc
Bought by
Holiday Thomas E
Current Estimated Value
Home Financials for this Owner
Home Financials are based on the most recent Mortgage that was taken out on this home.
Original Mortgage
$236,425
Outstanding Balance
$153,362
Interest Rate
5.11%
Mortgage Type
FHA
Estimated Equity
$322,998
Purchase Details
Closed on
Feb 3, 2009
Sold by
Thompson Kenneth
Bought by
Hsbc Mortgage Services Inc
Purchase Details
Closed on
Jul 7, 2006
Sold by
Christy Jennifer A
Bought by
Thompson Kenneth A and Thompson Tracy L
Home Financials for this Owner
Home Financials are based on the most recent Mortgage that was taken out on this home.
Original Mortgage
$324,450
Interest Rate
6.54%
Mortgage Type
New Conventional
Create a Home Valuation Report for This Property
The Home Valuation Report is an in-depth analysis detailing your home's value as well as a comparison with similar homes in the area
Home Values in the Area
Average Home Value in this Area
Purchase History
| Date | Buyer | Sale Price | Title Company |
|---|---|---|---|
| Holiday Thomas E | $245,000 | -- | |
| Hsbc Mortgage Services Inc | -- | -- | |
| Thompson Kenneth A | $324,450 | -- |
Source: Public Records
Mortgage History
| Date | Status | Borrower | Loan Amount |
|---|---|---|---|
| Open | Holiday Thomas E | $236,425 | |
| Previous Owner | Thompson Kenneth A | $324,450 |
Source: Public Records
Tax History Compared to Growth
Tax History
| Year | Tax Paid | Tax Assessment Tax Assessment Total Assessment is a certain percentage of the fair market value that is determined by local assessors to be the total taxable value of land and additions on the property. | Land | Improvement |
|---|---|---|---|---|
| 2024 | $3,728 | $155,160 | $32,000 | $123,160 |
| 2023 | $3,725 | $137,360 | $32,000 | $105,360 |
| 2022 | $3,391 | $135,360 | $32,000 | $103,360 |
| 2021 | $2,998 | $116,720 | $32,000 | $84,720 |
| 2020 | $2,805 | $112,720 | $32,000 | $80,720 |
| 2019 | $2,841 | $108,520 | $28,000 | $80,520 |
| 2018 | $2,792 | $108,520 | $28,000 | $80,520 |
| 2017 | $2,605 | $107,000 | $26,400 | $80,600 |
| 2016 | $2,534 | $103,080 | $24,000 | $79,080 |
| 2015 | $2,479 | $100,440 | $24,000 | $76,440 |
| 2014 | $2,504 | $101,240 | $24,000 | $77,240 |
Source: Public Records
Map
Nearby Homes
- 131 Brigham Dr
- 86 Brigham Dr
- 799 Brigham Dr
- 15 Sabal Dr
- 446 Brigham Dr
- 154 Sayle Ln
- 190 Sayle Ln
- 831 Sweet Hill Rd
- 63 Saddlebrook Dr
- 330 Wicklow Dr
- 16 Old Martin Ln
- 271 Davis Rd
- 89 Marsh Hen Ln
- 659 Harbour Ln
- 352 Harbour Ln
- 187 Harbour Ln
- 567 Foxtail Dr
- 268 Catherine View
- 385 Timberland Cir
- 382 Savannah Rd
- 216 Brigham Dr
- 152 Brigham Dr
- 159 Brigham Dr
- 185 Brigham Dr
- 215 Brigham Dr
- 124 Brigham Dr
- 910 Brigham Dr
- 245 Brigham Dr
- 19186 Ga Highway 144
- 19152 Ga Highway 144
- 19226 Ga Highway 144
- 103 Brigham Dr
- 19122 Ga Highway 144
- 19122 Georgia 144
- 271 Brigham Dr
- 19256 Ga Highway 144
- 908 Brigham Dr
- 296 Brigham Dr
- 912 Brigham Dr
- 52 Brigham Dr