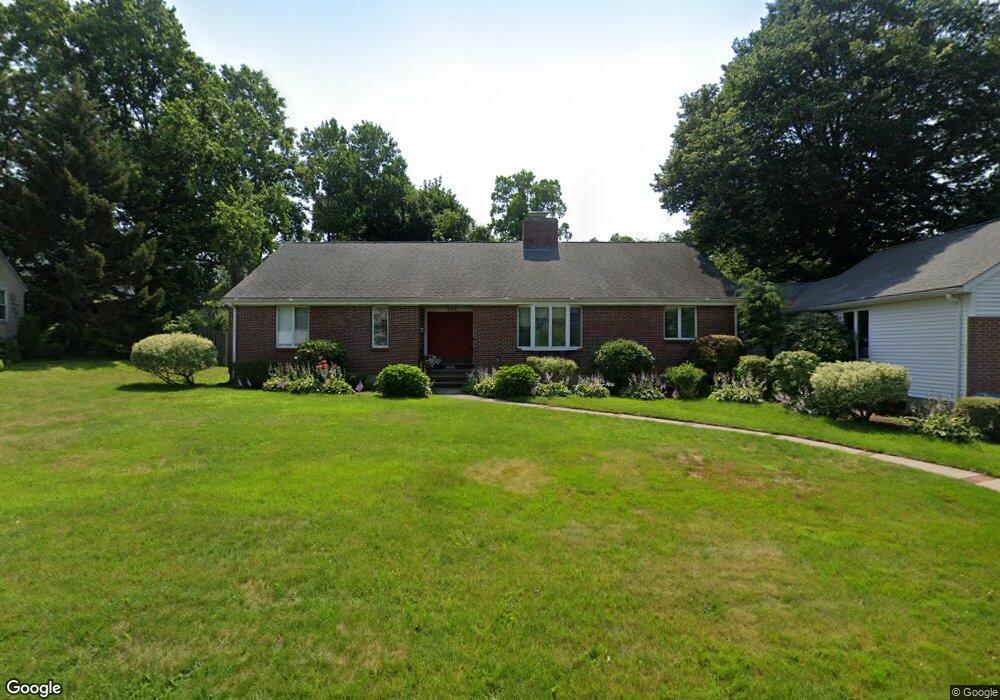
182 Colonial Dr Quincy, MA 02169
Quincy Center NeighborhoodEstimated Value: $956,209 - $1,207,000
3
Beds
3
Baths
2,064
Sq Ft
$529/Sq Ft
Est. Value
About This Home
This home is located at 182 Colonial Dr, Quincy, MA 02169 and is currently estimated at $1,092,552, approximately $529 per square foot. 182 Colonial Dr is a home located in Norfolk County with nearby schools including Charles A. Bernazzani Elementary School, Central Middle School, and Quincy High School.
Ownership History
Date
Name
Owned For
Owner Type
Purchase Details
Closed on
Aug 11, 2015
Sold by
Faherty Mary J
Bought by
Mary J Faherty Ret
Current Estimated Value
Purchase Details
Closed on
May 21, 2015
Sold by
Faherty Francis P and Faherty Mary J
Bought by
Faherty Mary J
Purchase Details
Closed on
Jan 27, 2005
Sold by
Mary-Ellen Losordo Nt and Losordo Mary Ellen
Bought by
Faherty Francis P and Faherty Mary J
Home Financials for this Owner
Home Financials are based on the most recent Mortgage that was taken out on this home.
Original Mortgage
$100,000
Interest Rate
5.67%
Mortgage Type
Purchase Money Mortgage
Purchase Details
Closed on
May 11, 1992
Sold by
Cruickshank Tr Gary W
Bought by
Losordo Mary E
Create a Home Valuation Report for This Property
The Home Valuation Report is an in-depth analysis detailing your home's value as well as a comparison with similar homes in the area
Home Values in the Area
Average Home Value in this Area
Purchase History
| Date | Buyer | Sale Price | Title Company |
|---|---|---|---|
| Mary J Faherty Ret | -- | -- | |
| Faherty Mary J | -- | -- | |
| Faherty Francis P | $637,000 | -- | |
| Losordo Mary E | $20,000 | -- |
Source: Public Records
Mortgage History
| Date | Status | Borrower | Loan Amount |
|---|---|---|---|
| Previous Owner | Faherty Francis P | $100,000 | |
| Previous Owner | Losordo Mary E | $87,000 | |
| Previous Owner | Losordo Mary E | $30,000 | |
| Previous Owner | Losordo Mary E | $105,000 |
Source: Public Records
Tax History Compared to Growth
Tax History
| Year | Tax Paid | Tax Assessment Tax Assessment Total Assessment is a certain percentage of the fair market value that is determined by local assessors to be the total taxable value of land and additions on the property. | Land | Improvement |
|---|---|---|---|---|
| 2025 | $9,615 | $833,900 | $324,500 | $509,400 |
| 2024 | $9,465 | $839,800 | $309,900 | $529,900 |
| 2023 | $8,937 | $803,000 | $283,300 | $519,700 |
| 2022 | $9,590 | $800,500 | $259,100 | $541,400 |
| 2021 | $8,867 | $730,400 | $259,100 | $471,300 |
| 2020 | $8,672 | $697,700 | $247,500 | $450,200 |
| 2019 | $8,524 | $679,200 | $234,500 | $444,700 |
| 2018 | $8,524 | $639,000 | $234,500 | $404,500 |
| 2017 | $8,187 | $577,800 | $224,200 | $353,600 |
| 2016 | $7,747 | $539,500 | $214,300 | $325,200 |
| 2015 | $7,109 | $486,900 | $214,300 | $272,600 |
| 2014 | -- | $474,500 | $204,900 | $269,600 |
Source: Public Records
Map
Nearby Homes
- 312 Adams St
- 25 Carrolls Ln
- 14 Priscilla Ln
- 89 Puritan Dr
- 57 Willow Ave
- 118 Dimmock St
- 1 Cityview Ln Unit 204
- 1 Cityview Ln Unit 506
- 1 Cityview Ln Unit 303
- 77 Adams St Unit 610
- 1025 Hancock St Unit 12K
- 1025 Hancock St Unit 1F
- 1025 Hancock St Unit 1K
- 73 Cranch St Unit 73
- 29 Oval Rd
- 165 Old Colony Ave Unit A
- 9 Common St Unit 3
- 129 Grand View Ave
- 40 Greenleaf St Unit 102
- 20 Whitney Rd