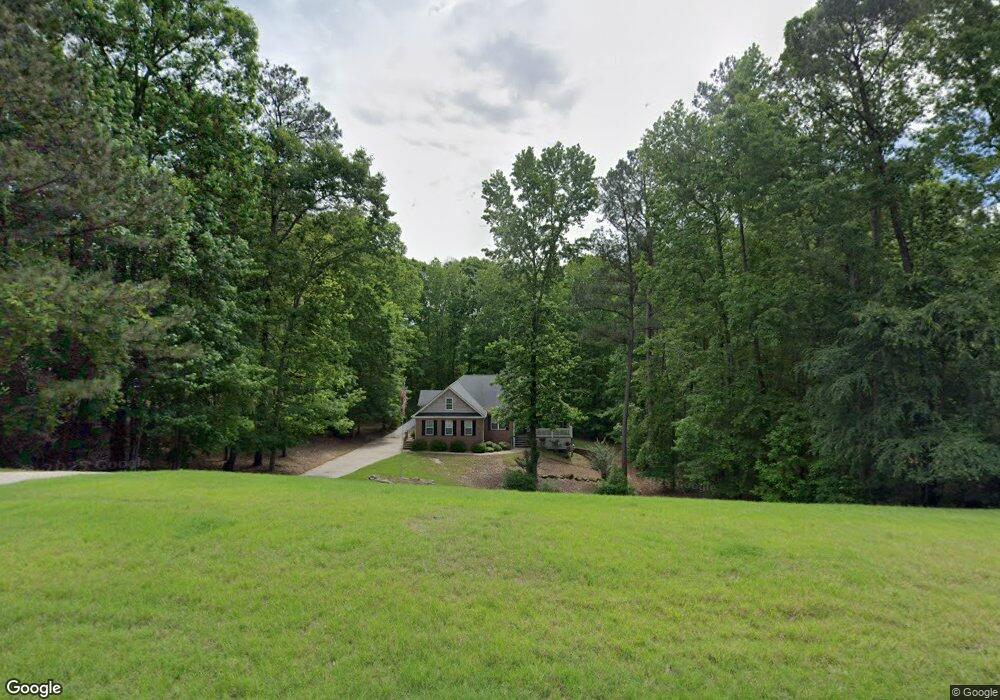
182 Dawn St Newnan, GA 30263
Estimated Value: $443,000 - $531,000
3
Beds
4
Baths
2,608
Sq Ft
$188/Sq Ft
Est. Value
About This Home
This home is located at 182 Dawn St, Newnan, GA 30263 and is currently estimated at $490,549, approximately $188 per square foot. 182 Dawn St is a home located in Coweta County with nearby schools including Arnco-Sargent Elementary School, Madras Middle School, and Newnan High School.
Ownership History
Date
Name
Owned For
Owner Type
Purchase Details
Closed on
Oct 13, 2010
Sold by
Moran Glenda H
Bought by
Moran Michael P
Current Estimated Value
Home Financials for this Owner
Home Financials are based on the most recent Mortgage that was taken out on this home.
Original Mortgage
$150,000
Outstanding Balance
$1,096
Interest Rate
3.86%
Mortgage Type
New Conventional
Estimated Equity
$489,453
Purchase Details
Closed on
Sep 10, 2007
Sold by
Gerald M Rudder Const Inc
Bought by
Moran Michael P and Moran Glenda H
Home Financials for this Owner
Home Financials are based on the most recent Mortgage that was taken out on this home.
Original Mortgage
$160,000
Interest Rate
6.65%
Mortgage Type
New Conventional
Purchase Details
Closed on
Apr 11, 2007
Sold by
Rudder Lubie Enterprises Inc
Bought by
Gerald M Rudder Construction Inc
Purchase Details
Closed on
Feb 29, 1996
Bought by
Rudder Lubie Enterprises Inc
Create a Home Valuation Report for This Property
The Home Valuation Report is an in-depth analysis detailing your home's value as well as a comparison with similar homes in the area
Home Values in the Area
Average Home Value in this Area
Purchase History
| Date | Buyer | Sale Price | Title Company |
|---|---|---|---|
| Moran Michael P | -- | -- | |
| Moran Michael P | $261,900 | -- | |
| Gerald M Rudder Construction Inc | $35,000 | -- | |
| Rudder Lubie Enterprises Inc | $536,000 | -- |
Source: Public Records
Mortgage History
| Date | Status | Borrower | Loan Amount |
|---|---|---|---|
| Open | Moran Michael P | $150,000 | |
| Previous Owner | Moran Michael P | $160,000 |
Source: Public Records
Tax History Compared to Growth
Tax History
| Year | Tax Paid | Tax Assessment Tax Assessment Total Assessment is a certain percentage of the fair market value that is determined by local assessors to be the total taxable value of land and additions on the property. | Land | Improvement |
|---|---|---|---|---|
| 2024 | $4,431 | $195,454 | $22,000 | $173,454 |
| 2023 | $4,431 | $196,676 | $22,000 | $174,676 |
| 2022 | $3,766 | $157,577 | $22,000 | $135,577 |
| 2021 | $3,233 | $127,502 | $18,000 | $109,502 |
| 2020 | $3,254 | $127,502 | $18,000 | $109,502 |
| 2019 | $2,680 | $96,364 | $14,000 | $82,364 |
| 2018 | $2,685 | $96,364 | $14,000 | $82,364 |
| 2017 | $2,664 | $95,683 | $14,000 | $81,683 |
| 2016 | $2,322 | $84,876 | $10,000 | $74,876 |
| 2015 | $1,994 | $74,666 | $10,000 | $64,666 |
| 2014 | $1,693 | $64,456 | $10,000 | $54,456 |
Source: Public Records
Map
Nearby Homes
- 1206 + 0 Macedonia Rd
- 1206 Macedonia Rd
- 279 Doc Perry Rd
- 50 Emerald Hills Ln
- 0 & 1206 Macedonia Rd
- 5 Gibson Rd
- 100 Rudders Crossing
- 124 Wilmington Ct
- 1985 Roscoe Rd
- 1965 Roscoe Rd
- 1242 Witcher Rd
- 0 Piney Wood Dr Unit 9 10589519
- 249 Gibson Rd
- 558 Macedonia Rd
- 0 J Smith Rd Unit 10192890
- 97 Windsor Ct
- 171 Brimer Rd
- 3009 Roscoe Rd
- 90 Pegasus Trace
- 44 Fendley Trace
- 168 Dawn St
- 200 Dawn St
- 350 O Tara Woods Dr
- 183 Dawn St
- 330 O'Tara Woods Dr
- 330 O Tara Woods Dr
- 340 O Tara Woods Dr
- 45 Butler Ln
- 201 Dawn St
- 360 O Tara Woods Dr
- 171 Dawn St
- 140 Dawn St
- 35 Butler Ln
- 15 Butler Ln
- 15 Butler Ln Unit c38
- 25 Butler Ln
- 365 O Tara Woods Dr
- 335 Otara Woods Dr
- 335 O'Tara Woods Dr
- 5 Butler Ln