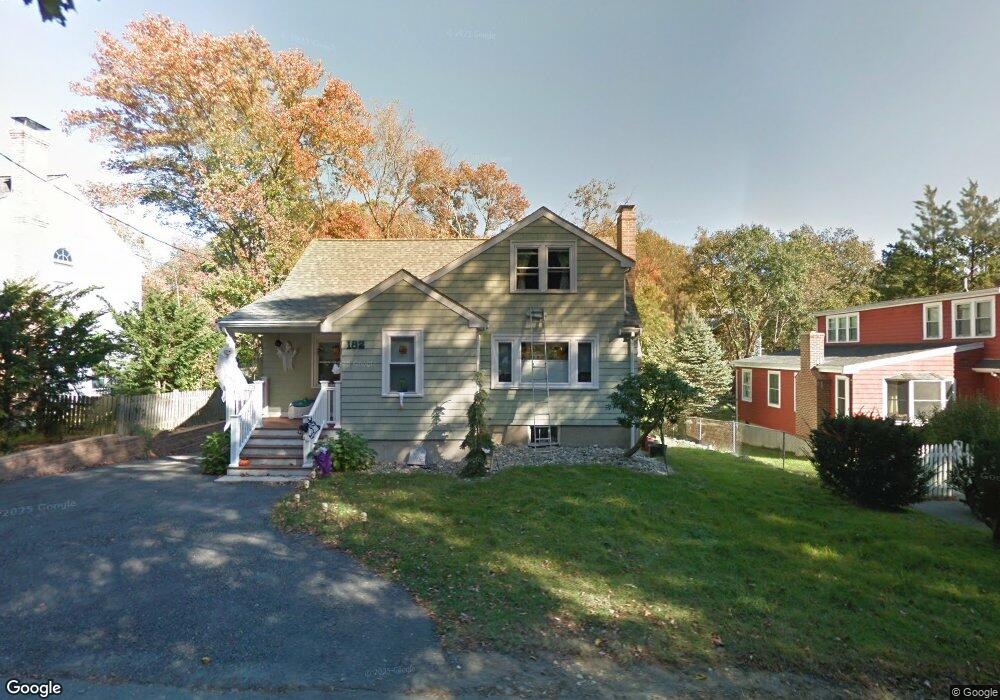
182 Dothan St Winchester, MA 01890
West Side NeighborhoodEstimated Value: $891,000 - $1,244,747
4
Beds
2
Baths
2,272
Sq Ft
$500/Sq Ft
Est. Value
About This Home
This home is located at 182 Dothan St, Winchester, MA 01890 and is currently estimated at $1,136,937, approximately $500 per square foot. 182 Dothan St is a home located in Middlesex County with nearby schools including Vinson-Owen Elementary School, McCall Middle School, and Winchester High School.
Ownership History
Date
Name
Owned For
Owner Type
Purchase Details
Closed on
Jul 15, 2004
Sold by
Faga Louise M and Tenney Suzanne M
Bought by
Siciliano Nicola A and Savoca Tiziana
Current Estimated Value
Home Financials for this Owner
Home Financials are based on the most recent Mortgage that was taken out on this home.
Original Mortgage
$296,000
Outstanding Balance
$148,167
Interest Rate
6.25%
Mortgage Type
Purchase Money Mortgage
Estimated Equity
$988,770
Create a Home Valuation Report for This Property
The Home Valuation Report is an in-depth analysis detailing your home's value as well as a comparison with similar homes in the area
Home Values in the Area
Average Home Value in this Area
Purchase History
| Date | Buyer | Sale Price | Title Company |
|---|---|---|---|
| Siciliano Nicola A | $370,000 | -- |
Source: Public Records
Mortgage History
| Date | Status | Borrower | Loan Amount |
|---|---|---|---|
| Open | Siciliano Nicola A | $296,000 |
Source: Public Records
Tax History
| Year | Tax Paid | Tax Assessment Tax Assessment Total Assessment is a certain percentage of the fair market value that is determined by local assessors to be the total taxable value of land and additions on the property. | Land | Improvement |
|---|---|---|---|---|
| 2025 | $109 | $983,200 | $589,000 | $394,200 |
| 2024 | $11,124 | $981,800 | $589,000 | $392,800 |
| 2023 | $10,745 | $910,600 | $539,900 | $370,700 |
| 2022 | $9,708 | $776,000 | $409,000 | $367,000 |
| 2021 | $6,117 | $767,800 | $400,800 | $367,000 |
| 2020 | $9,513 | $767,800 | $400,800 | $367,000 |
| 2019 | $8,506 | $702,400 | $335,400 | $367,000 |
| 2018 | $8,222 | $674,500 | $319,000 | $355,500 |
| 2017 | $7,800 | $635,200 | $302,700 | $332,500 |
| 2016 | $7,285 | $623,700 | $302,700 | $321,000 |
| 2015 | $7,055 | $581,100 | $274,000 | $307,100 |
| 2014 | $6,774 | $535,100 | $237,200 | $297,900 |
Source: Public Records
Map
Nearby Homes
Your Personal Tour Guide
Ask me questions while you tour the home.