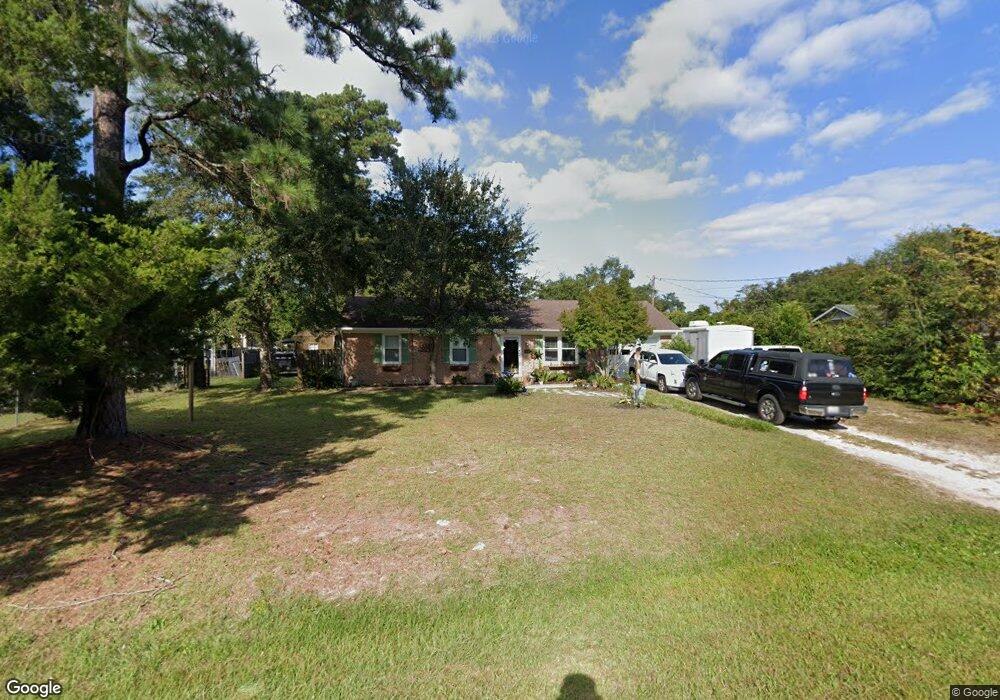
182 E Brandywine Cir Wilmington, NC 28411
Estimated Value: $276,000 - $330,000
3
Beds
2
Baths
1,083
Sq Ft
$283/Sq Ft
Est. Value
About This Home
This home is located at 182 E Brandywine Cir, Wilmington, NC 28411 and is currently estimated at $306,976, approximately $283 per square foot. 182 E Brandywine Cir is a home located in New Hanover County with nearby schools including Ogden Elementary School, M.C.S. Noble Middle School, and Emsley A. Laney High School.
Ownership History
Date
Name
Owned For
Owner Type
Purchase Details
Closed on
Apr 7, 2010
Sold by
The Rents At Topsul Llc
Bought by
Lewis Vikki D
Current Estimated Value
Home Financials for this Owner
Home Financials are based on the most recent Mortgage that was taken out on this home.
Original Mortgage
$126,663
Outstanding Balance
$85,074
Interest Rate
5.25%
Mortgage Type
FHA
Estimated Equity
$221,902
Purchase Details
Closed on
Aug 18, 2006
Sold by
Parrish Edward S and Parrish Margaret W
Bought by
The Rents At Topsul Llc
Purchase Details
Closed on
May 1, 1990
Sold by
Johnson Jr Alton B
Bought by
Parrish Edward S Iii Margaret
Purchase Details
Closed on
Sep 1, 1985
Sold by
Brozinski Frank J
Bought by
Johnson Alton B
Purchase Details
Closed on
Feb 1, 1983
Sold by
York Glenn Lesley
Bought by
Brozinski Frank J
Purchase Details
Closed on
Mar 1, 1974
Bought by
York Glenn Lesley
Create a Home Valuation Report for This Property
The Home Valuation Report is an in-depth analysis detailing your home's value as well as a comparison with similar homes in the area
Home Values in the Area
Average Home Value in this Area
Purchase History
| Date | Buyer | Sale Price | Title Company |
|---|---|---|---|
| Lewis Vikki D | $129,000 | None Available | |
| The Rents At Topsul Llc | -- | None Available | |
| Parrish Edward S Iii Margaret | $52,000 | -- | |
| Johnson Alton B | $28,500 | -- | |
| Brozinski Frank J | $36,000 | -- | |
| York Glenn Lesley | $21,300 | -- |
Source: Public Records
Mortgage History
| Date | Status | Borrower | Loan Amount |
|---|---|---|---|
| Open | Lewis Vikki D | $126,663 |
Source: Public Records
Tax History
| Year | Tax Paid | Tax Assessment Tax Assessment Total Assessment is a certain percentage of the fair market value that is determined by local assessors to be the total taxable value of land and additions on the property. | Land | Improvement |
|---|---|---|---|---|
| 2025 | $1,160 | $286,900 | $124,700 | $162,200 |
| 2023 | $1,111 | $199,700 | $70,300 | $129,400 |
| 2022 | $1,121 | $199,700 | $70,300 | $129,400 |
| 2021 | $1,105 | $199,700 | $70,300 | $129,400 |
| 2020 | $768 | $121,400 | $50,100 | $71,300 |
| 2019 | $745 | $117,800 | $50,100 | $67,700 |
| 2018 | $745 | $117,800 | $50,100 | $67,700 |
| 2017 | $763 | $117,800 | $50,100 | $67,700 |
| 2016 | $888 | $128,100 | $61,800 | $66,300 |
| 2015 | $825 | $128,100 | $61,800 | $66,300 |
| 2014 | $811 | $128,100 | $61,800 | $66,300 |
Source: Public Records
Map
Nearby Homes
- 3533 Middle Sound Loop Rd
- 133 Ludlow Dr
- 6422 Serena Ct
- 7106 Haven Way
- 202 W Bedford Rd
- 7124 Maple Leaf Dr
- 6509 Old Fort Rd
- 633 Countryside Ln
- 207 Vistamar Dr
- 233 Buff Cir
- 900 Middle Sound Loop Rd
- 625 Dundee Dr
- 628 Middle Sound Loop Rd
- 218 Wagon Wheel Way
- 7110 Long Boat Cir
- 313 Lord Dr
- 75 Snug Harbour Dr
- 1106 Boone Ln
- 7414 Richfield Ct
- 7347 Bright Leaf Rd
- 178 E Brandywine Cir
- 157 W Brandywine Cir
- 153 E Brandywine Cir
- 153 W Brandywine Cir
- 153 W Brandywine Cir
- 133 Salem Ct
- 174 E Brandywine Cir
- 129 Salem Ct
- 175 E Brandywine Cir
- 171 E Brandywine Cir
- 179 E Brandywine Cir
- 162 W Brandywine Cir
- 149 W Brandywine Cir
- 167 E Brandywine Cir
- 170 E Brandywine Cir
- 158 W Brandywine Cir
- 125 Salem Ct
- 150 W Brandywine Cir
- 154 W Brandywine Cir
- 145 E Brandywine Cir
Your Personal Tour Guide
Ask me questions while you tour the home.