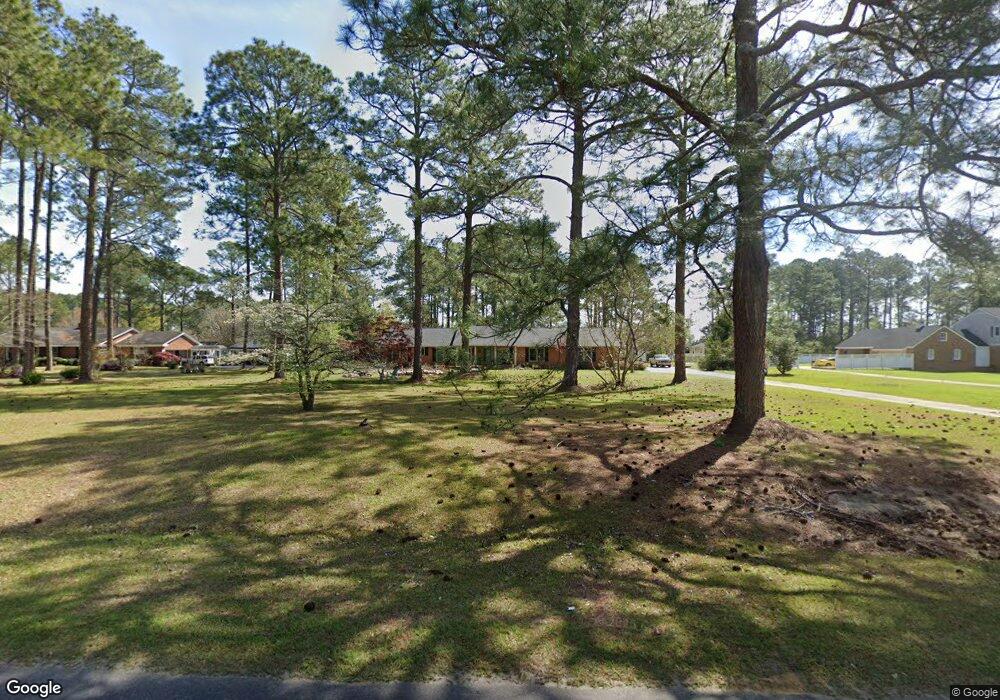
182 El Harris Rd Fitzgerald, GA 31750
Estimated Value: $270,000 - $414,000
4
Beds
3
Baths
3,094
Sq Ft
$108/Sq Ft
Est. Value
About This Home
This home is located at 182 El Harris Rd, Fitzgerald, GA 31750 and is currently estimated at $335,137, approximately $108 per square foot. 182 El Harris Rd is a home located in Ben Hill County with nearby schools including Ben Hill County Primary School, Ben Hill Elementary School, and Ben Hill County Middle School.
Ownership History
Date
Name
Owned For
Owner Type
Purchase Details
Closed on
Sep 4, 2013
Sold by
Steverson James W
Bought by
Couch Thomas Jason and Couch Stephanie D
Current Estimated Value
Home Financials for this Owner
Home Financials are based on the most recent Mortgage that was taken out on this home.
Original Mortgage
$156,400
Interest Rate
4.39%
Mortgage Type
New Conventional
Purchase Details
Closed on
Aug 28, 2009
Sold by
Shepard Anthony Bruce
Bought by
Steverson Lavonia W
Home Financials for this Owner
Home Financials are based on the most recent Mortgage that was taken out on this home.
Original Mortgage
$155,628
Interest Rate
5.19%
Mortgage Type
FHA
Purchase Details
Closed on
Jun 3, 2002
Sold by
Kirkpatrick George
Bought by
Shepard Anthony B and Shepard Kristen L
Purchase Details
Closed on
Oct 3, 1983
Bought by
Kirkpatrick George
Create a Home Valuation Report for This Property
The Home Valuation Report is an in-depth analysis detailing your home's value as well as a comparison with similar homes in the area
Home Values in the Area
Average Home Value in this Area
Purchase History
| Date | Buyer | Sale Price | Title Company |
|---|---|---|---|
| Couch Thomas Jason | $184,100 | -- | |
| Steverson Lavonia W | $158,500 | -- | |
| Shepard Anthony B | $160,000 | -- | |
| Kirkpatrick George | $95,000 | -- |
Source: Public Records
Mortgage History
| Date | Status | Borrower | Loan Amount |
|---|---|---|---|
| Closed | Couch Thomas Jason | $156,400 | |
| Previous Owner | Steverson Lavonia W | $155,628 |
Source: Public Records
Tax History Compared to Growth
Tax History
| Year | Tax Paid | Tax Assessment Tax Assessment Total Assessment is a certain percentage of the fair market value that is determined by local assessors to be the total taxable value of land and additions on the property. | Land | Improvement |
|---|---|---|---|---|
| 2024 | $3,814 | $93,713 | $8,400 | $85,313 |
| 2023 | $2,061 | $91,216 | $8,400 | $82,816 |
| 2022 | $2,420 | $79,182 | $8,400 | $70,782 |
| 2021 | $2,327 | $73,733 | $8,400 | $65,333 |
| 2020 | $2,323 | $72,844 | $8,400 | $64,444 |
| 2019 | $2,210 | $69,844 | $5,400 | $64,444 |
| 2018 | $2,993 | $69,466 | $5,400 | $64,066 |
| 2017 | $2,182 | $68,709 | $5,400 | $63,309 |
| 2016 | $2,045 | $67,531 | $5,400 | $62,131 |
| 2015 | -- | $67,531 | $5,400 | $62,131 |
| 2014 | -- | $66,344 | $5,400 | $60,944 |
Source: Public Records
Map
Nearby Homes
- 114 Creole Ct
- 141 Wenona Way
- 112 Manor Dr
- 178 Burnside Rd
- 146 Franklin Ave
- 243 Perry House Rd
- 0 Benjamin H Hill Dr Unit 21545626
- 107 Manassas Place
- 112 Perry House Rd
- 0 Lincoln Ave
- 225 Meadowlark Ln
- 105 Halsey St
- 249 Lincoln Ave
- 271 Lincoln Ave
- 117 Meadowlark Ln
- 277 Lincoln Ave
- 152 David Dr
- 138 Azalea Ln
- 200 Irwinville Hwy
- 204 Irwinville Hwy
- 190 El Harris Rd
- 176 El Harris Rd
- 117 Wellington Dr
- 181 El Harris Rd
- 187 El Harris Rd
- 111 Wellington Dr
- 177 El Harris Rd
- 119 Wellington Dr
- 168 El Harris Rd
- 106 Stratford St E
- 191 El Harris Rd
- 105 Wellington Dr
- -- Wellington Dr
- 0 Wellington Dr
- 169 El Harris Rd
- 106 Edinburg Dr
- 112 Edinburg Dr
- 102 Edinburg Dr
- 197 El Harris Rd
- o Edinburg Dr