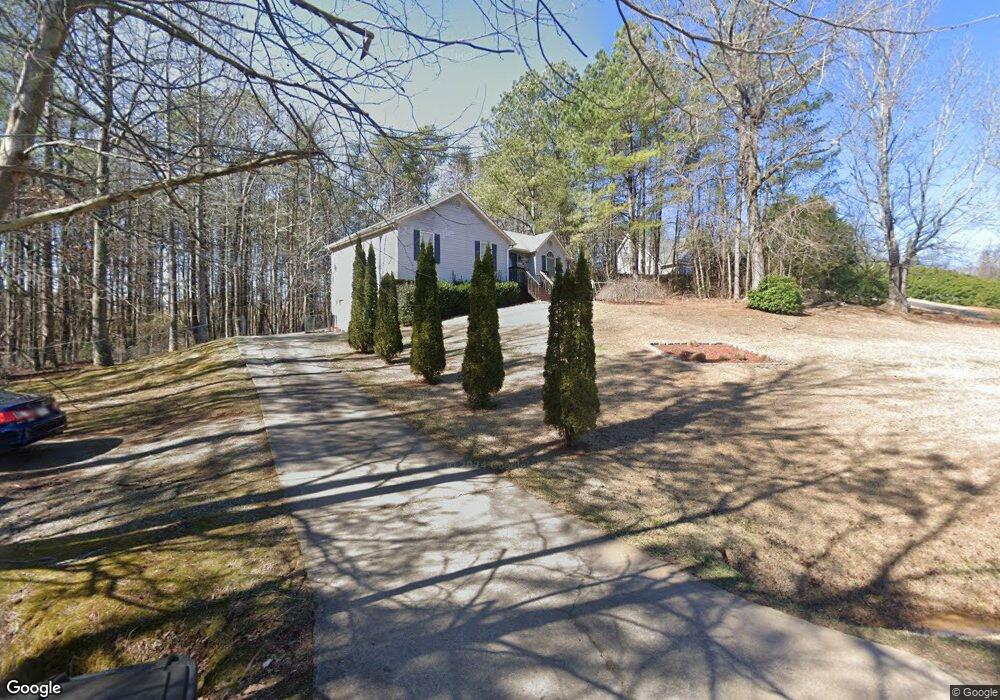
182 Emerald Ln Jasper, GA 30143
Estimated Value: $285,000 - $327,000
3
Beds
2
Baths
1,397
Sq Ft
$218/Sq Ft
Est. Value
About This Home
This home is located at 182 Emerald Ln, Jasper, GA 30143 and is currently estimated at $304,933, approximately $218 per square foot. 182 Emerald Ln is a home located in Pickens County with nearby schools including Harmony Elementary School, Pickens County Middle School, and Pickens County High School.
Ownership History
Date
Name
Owned For
Owner Type
Purchase Details
Closed on
Sep 28, 2011
Sold by
Homesales Inc
Bought by
Henderson Terry L
Current Estimated Value
Home Financials for this Owner
Home Financials are based on the most recent Mortgage that was taken out on this home.
Original Mortgage
$104,658
Outstanding Balance
$70,883
Interest Rate
4.26%
Mortgage Type
New Conventional
Estimated Equity
$234,050
Purchase Details
Closed on
Feb 1, 2011
Sold by
Hancock John J
Bought by
Chase Home Finance Llc
Purchase Details
Closed on
Apr 21, 2009
Sold by
Holland Jason L
Bought by
Hancock John J
Home Financials for this Owner
Home Financials are based on the most recent Mortgage that was taken out on this home.
Original Mortgage
$137,784
Interest Rate
4.86%
Mortgage Type
New Conventional
Purchase Details
Closed on
Apr 27, 2006
Sold by
Andrews William N
Bought by
Holland Jason L
Purchase Details
Closed on
Jun 1, 1998
Bought by
Andrews William N
Purchase Details
Closed on
May 25, 1989
Bought by
Fleming Bob
Create a Home Valuation Report for This Property
The Home Valuation Report is an in-depth analysis detailing your home's value as well as a comparison with similar homes in the area
Home Values in the Area
Average Home Value in this Area
Purchase History
| Date | Buyer | Sale Price | Title Company |
|---|---|---|---|
| Henderson Terry L | $100,000 | -- | |
| Homesales Inc | -- | -- | |
| Chase Home Finance Llc | -- | -- | |
| Hancock John J | $135,100 | -- | |
| Holland Jason L | $137,500 | -- | |
| Andrews William N | $89,000 | -- | |
| Fleming Bob | -- | -- |
Source: Public Records
Mortgage History
| Date | Status | Borrower | Loan Amount |
|---|---|---|---|
| Open | Homesales Inc | $104,658 | |
| Closed | Henderson Terry L | $104,658 | |
| Previous Owner | Hancock John J | $137,784 |
Source: Public Records
Tax History
| Year | Tax Paid | Tax Assessment Tax Assessment Total Assessment is a certain percentage of the fair market value that is determined by local assessors to be the total taxable value of land and additions on the property. | Land | Improvement |
|---|---|---|---|---|
| 2025 | $1,597 | $88,163 | $8,800 | $79,363 |
| 2024 | $1,735 | $87,659 | $8,800 | $78,859 |
| 2023 | $1,297 | $63,756 | $8,800 | $54,956 |
| 2022 | $1,297 | $63,756 | $8,800 | $54,956 |
| 2021 | $1,389 | $63,756 | $8,800 | $54,956 |
| 2020 | $1,431 | $63,756 | $8,800 | $54,956 |
| 2019 | $1,154 | $50,272 | $8,800 | $41,472 |
| 2018 | $1,165 | $50,272 | $8,800 | $41,472 |
| 2017 | $1,184 | $50,272 | $8,800 | $41,472 |
| 2016 | $1,203 | $50,272 | $8,800 | $41,472 |
| 2015 | $1,175 | $50,272 | $8,800 | $41,472 |
| 2014 | $1,177 | $50,272 | $8,800 | $41,472 |
| 2013 | -- | $50,271 | $8,800 | $41,471 |
Source: Public Records
Map
Nearby Homes
- 232 Happy Trails Way
- 99 Davis Dr
- 51 Griffith Ave
- 6 Brittany Ct Unit 24
- 64 Brittany Ct Unit 15
- 275 Beth Ave
- 0 Log Swamp Dr Unit 10723404
- 73 Lambert St
- 429 Moore St
- 43 Lambert St
- 244 Town Creek Trail
- 3011 Refuge Rd
- 0 Hickory Trail Unit 405391
- 0 Hickory Trail Unit 10593185
- 5 Towne Villas Dr
- 28 Sandstone Dr
- 3049 Highway 53 E
- 348 Old Tate Rd
- 140 Rogers Ave
- 24 N Rim Dr
Your Personal Tour Guide
Ask me questions while you tour the home.