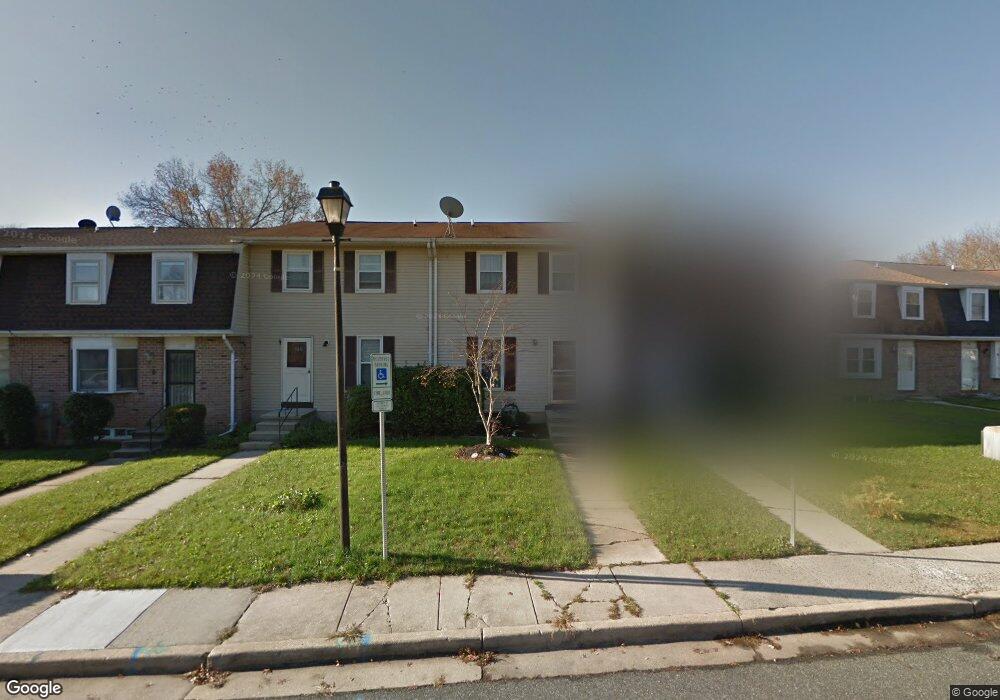
182 Farm Rd Aberdeen, MD 21001
Estimated Value: $186,000 - $241,000
Studio
2
Baths
1,320
Sq Ft
$165/Sq Ft
Est. Value
About This Home
This home is located at 182 Farm Rd, Aberdeen, MD 21001 and is currently estimated at $217,286, approximately $164 per square foot. 182 Farm Rd is a home located in Harford County with nearby schools including Halls Cross Roads Elementary School, Aberdeen Middle School, and Aberdeen High School.
Ownership History
Date
Name
Owned For
Owner Type
Purchase Details
Closed on
Jul 20, 2024
Sold by
Rhodes Derrick L and Sansone Chari L
Bought by
Sansone Chari L
Current Estimated Value
Home Financials for this Owner
Home Financials are based on the most recent Mortgage that was taken out on this home.
Original Mortgage
$92,000
Interest Rate
6.49%
Mortgage Type
New Conventional
Purchase Details
Closed on
May 5, 1999
Sold by
Visser Gary V
Bought by
Rhodes Derrick L and Sansone Chari L
Purchase Details
Closed on
Jun 30, 1989
Sold by
West Larry L
Bought by
Visser Gary
Home Financials for this Owner
Home Financials are based on the most recent Mortgage that was taken out on this home.
Original Mortgage
$57,200
Interest Rate
10.07%
Create a Home Valuation Report for This Property
The Home Valuation Report is an in-depth analysis detailing your home's value as well as a comparison with similar homes in the area
Home Values in the Area
Average Home Value in this Area
Purchase History
| Date | Buyer | Sale Price | Title Company |
|---|---|---|---|
| Sansone Chari L | $28,155 | None Listed On Document | |
| Sansone Chari L | $28,155 | None Listed On Document | |
| Rhodes Derrick L | $79,900 | -- | |
| Visser Gary | $68,000 | -- |
Source: Public Records
Mortgage History
| Date | Status | Borrower | Loan Amount |
|---|---|---|---|
| Previous Owner | Sansone Chari L | $92,000 | |
| Previous Owner | Visser Gary | $57,200 | |
| Closed | Rhodes Derrick L | -- |
Source: Public Records
Tax History
| Year | Tax Paid | Tax Assessment Tax Assessment Total Assessment is a certain percentage of the fair market value that is determined by local assessors to be the total taxable value of land and additions on the property. | Land | Improvement |
|---|---|---|---|---|
| 2025 | $1,379 | $154,800 | $0 | $0 |
| 2024 | $1,379 | $144,700 | $0 | $0 |
| 2023 | $1,283 | $134,600 | $37,000 | $97,600 |
| 2022 | $1,255 | $131,700 | $0 | $0 |
| 2021 | $1,266 | $128,800 | $0 | $0 |
| 2020 | $1,266 | $125,900 | $37,000 | $88,900 |
| 2019 | $1,248 | $124,133 | $0 | $0 |
| 2018 | $1,220 | $122,367 | $0 | $0 |
| 2017 | $1,197 | $120,600 | $0 | $0 |
| 2016 | -- | $120,133 | $0 | $0 |
| 2015 | $1,269 | $119,667 | $0 | $0 |
| 2014 | $1,269 | $119,200 | $0 | $0 |
Source: Public Records
Map
Nearby Homes
- 147 Bannister Ave
- 69 Baker St
- 479 Manor Rd
- 520 Beards Hill Rd
- 6 New County Rd
- 516 Beards Hill Rd
- 123 Wood Rd
- 303 Graceford Dr
- 126 W Inca St
- 302 Graceford Dr
- 642 Andrews Rd
- 631 W Bel Air Ave
- 3 Locust St
- 770 Custis St
- 125 Valley Rd
- 21 Gunnison Dr
- 0 Harford St Unit MDHR2039982
- 607 Northgate Rd
- 22 Liberty St
- 0 Paradise Rd
Your Personal Tour Guide
Ask me questions while you tour the home.