182 Kent St Nipomo, CA 93444
Estimated Value: $522,000 - $638,074
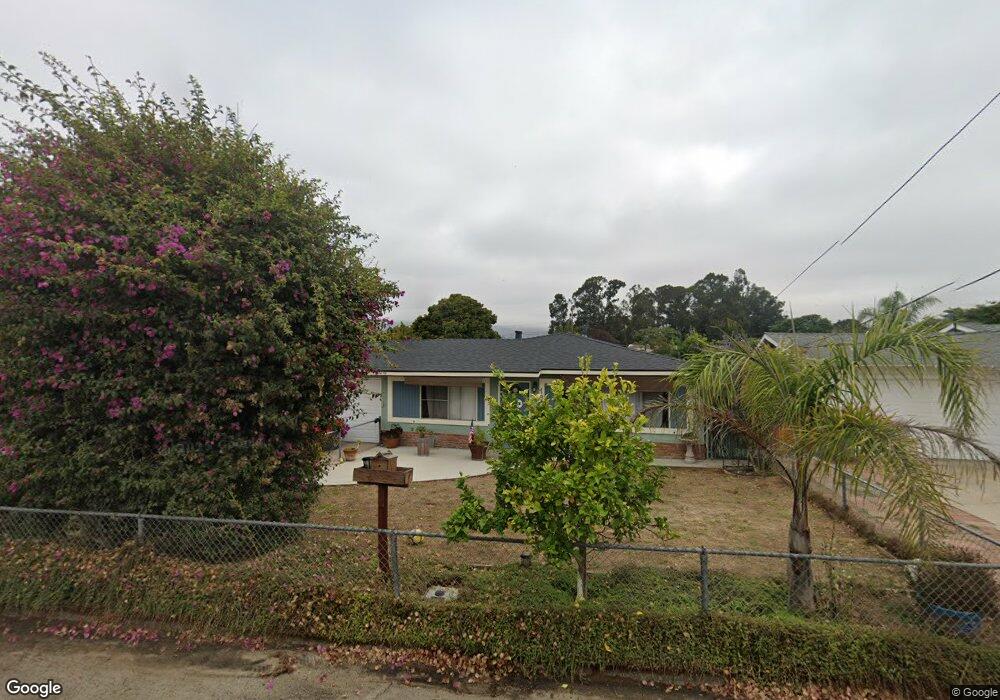
About This Home
This home is located at 182 Kent St, Nipomo, CA 93444 and is currently estimated at $584,019, approximately $503 per square foot. 182 Kent St is a home located in San Luis Obispo County with nearby schools including Nipomo Elementary School, Mesa Middle School, and Nipomo High School.
Ownership History
We collect this data history from publicly available records. To have your information removed, we recommend requesting removal directly through your county’s website.
Purchase Details
Home Financials for this Owner
Home Financials are based on the most recent Mortgage that was taken out on this home.Home Values in the Area
Average Home Value in this Area
Purchase History
We collect this data history from publicly available records. To have your information removed, we recommend requesting removal directly through your county’s website.
| Date | Buyer | Sale Price | Title Company |
|---|---|---|---|
| $350,000 | Placer Title Co |
Mortgage History
We collect this data history from publicly available records. To have your information removed, we recommend requesting removal directly through your county’s website.
| Date | Status | Borrower | Loan Amount |
|---|---|---|---|
| Open | $343,660 |
Tax History
We collect this data history from publicly available records. To have your information removed, we recommend requesting removal directly through your county’s website.
| Year | Tax Paid | Tax Assessment Tax Assessment Total Assessment is a certain percentage of the fair market value that is determined by local assessors to be the total taxable value of land and additions on the property. | Land | Improvement |
|---|---|---|---|---|
| 2025 | $4,155 | $390,426 | $223,101 | $167,325 |
| 2024 | $3,970 | $382,772 | $218,727 | $164,045 |
| 2023 | $3,970 | $375,268 | $214,439 | $160,829 |
| 2022 | $3,910 | $367,911 | $210,235 | $157,676 |
| 2021 | $3,903 | $360,698 | $206,113 | $154,585 |
| 2020 | $3,858 | $357,000 | $204,000 | $153,000 |
| 2019 | $3,835 | $350,000 | $200,000 | $150,000 |
| 2018 | $408 | $43,915 | $7,308 | $36,607 |
| 2017 | $398 | $43,055 | $7,165 | $35,890 |
| 2016 | $374 | $42,212 | $7,025 | $35,187 |
| 2015 | $368 | $41,579 | $6,920 | $34,659 |
| 2014 | $353 | $40,766 | $6,785 | $33,981 |
Map
- 160 San Antonio Ln
- 449 W Tefft St Unit 5
- 449 W Tefft St Unit 41
- 400 N Oakglen Ave
- 267 W Tefft St
- 205 W Tefft St
- 549 Hill St
- 228 Chaparral Ln
- 680 Hill St
- 719 W Tefft St
- 778 Primrose Ln
- 0 S Burton St
- 775 W Tefft St
- 525 Grande Ave
- 187 Amaranth Ln
- 336 Butterfly Ln
- 236 Scarlett Cir
- 440 N Oakglen Ave
- 370 Avenida de Amigos
- 150 E Chestnut St
Ask me questions while you tour the home.