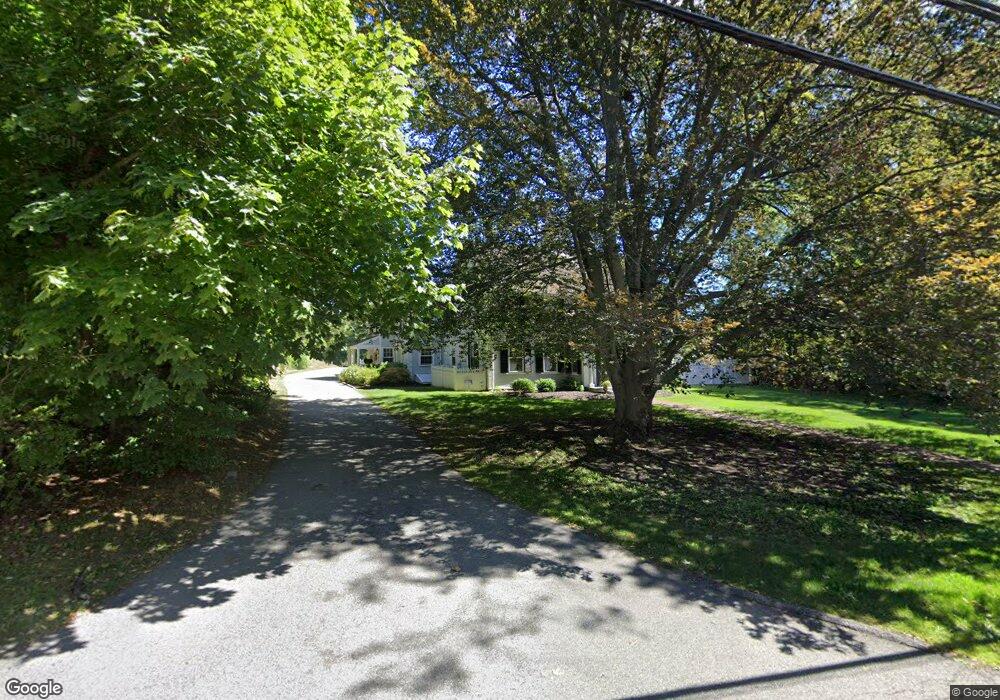
182 Main St Hingham, MA 02043
Estimated Value: $3,771,992 - $4,136,000
5
Beds
7
Baths
6,640
Sq Ft
$602/Sq Ft
Est. Value
About This Home
This home is located at 182 Main St, Hingham, MA 02043 and is currently estimated at $3,998,331, approximately $602 per square foot. 182 Main St is a home located in Plymouth County with nearby schools including East Elementary School, Hingham Middle School, and Hingham High School.
Ownership History
Date
Name
Owned For
Owner Type
Purchase Details
Closed on
Mar 1, 2005
Sold by
Howard Robert P and Howard Ann C
Bought by
Vonderluft Hans and Vonderluft Stephanie
Current Estimated Value
Home Financials for this Owner
Home Financials are based on the most recent Mortgage that was taken out on this home.
Original Mortgage
$750,000
Interest Rate
5.73%
Mortgage Type
Purchase Money Mortgage
Purchase Details
Closed on
Nov 22, 2004
Sold by
Howard Robert P
Bought by
Howard Robert P and Howard Ann C
Purchase Details
Closed on
Jan 12, 1996
Sold by
Bank Of Boston
Bought by
Sturkie George
Purchase Details
Closed on
Nov 26, 1990
Sold by
Security Pacific Fin
Bought by
Deangelis Douglas A
Create a Home Valuation Report for This Property
The Home Valuation Report is an in-depth analysis detailing your home's value as well as a comparison with similar homes in the area
Purchase History
| Date | Buyer | Sale Price | Title Company |
|---|---|---|---|
| Vonderluft Hans | $2,050,000 | -- | |
| Howard Robert P | -- | -- | |
| Sturkie George | $59,000 | -- | |
| Deangelis Douglas A | $110,000 | -- |
Source: Public Records
Mortgage History
| Date | Status | Borrower | Loan Amount |
|---|---|---|---|
| Open | Deangelis Douglas A | $1,000,000 | |
| Closed | Deangelis Douglas A | $750,000 |
Source: Public Records
Tax History
| Year | Tax Paid | Tax Assessment Tax Assessment Total Assessment is a certain percentage of the fair market value that is determined by local assessors to be the total taxable value of land and additions on the property. | Land | Improvement |
|---|---|---|---|---|
| 2025 | $35,225 | $3,295,100 | $1,090,300 | $2,204,800 |
| 2024 | $35,232 | $3,247,200 | $1,090,300 | $2,156,900 |
| 2023 | $31,801 | $3,180,100 | $1,090,300 | $2,089,800 |
| 2022 | $30,529 | $2,640,900 | $918,800 | $1,722,100 |
| 2021 | $29,767 | $2,522,600 | $867,600 | $1,655,000 |
| 2020 | $28,193 | $2,445,200 | $867,600 | $1,577,600 |
| 2019 | $28,554 | $2,417,800 | $867,600 | $1,550,200 |
| 2018 | $27,921 | $2,372,200 | $867,600 | $1,504,600 |
| 2017 | $27,449 | $2,240,700 | $878,400 | $1,362,300 |
| 2016 | $27,509 | $2,202,500 | $840,200 | $1,362,300 |
| 2015 | $26,858 | $2,143,500 | $781,200 | $1,362,300 |
Source: Public Records
Map
Nearby Homes
- 29 Chief Justice Cushing Hwy
- 9 Barnes Rd
- 82 East St
- 65 East St
- 19 Lantern Ln
- 14 Spring St
- 10R Martins Ln
- 1 Rockland St
- 21 Hersey St
- 2 Woodbine Ln
- 7 Lewis Ct
- 22 Del Prete Dr
- 8 Evergreen Ln
- 225 South St Unit 1
- 168 Stayner Dr Unit 168
- 10 Popes Ln
- 101 Rockland St
- 34 Otis Hill Rd
- 33 Turkey Hill Ln
- 112 Martins Ln
Your Personal Tour Guide
Ask me questions while you tour the home.