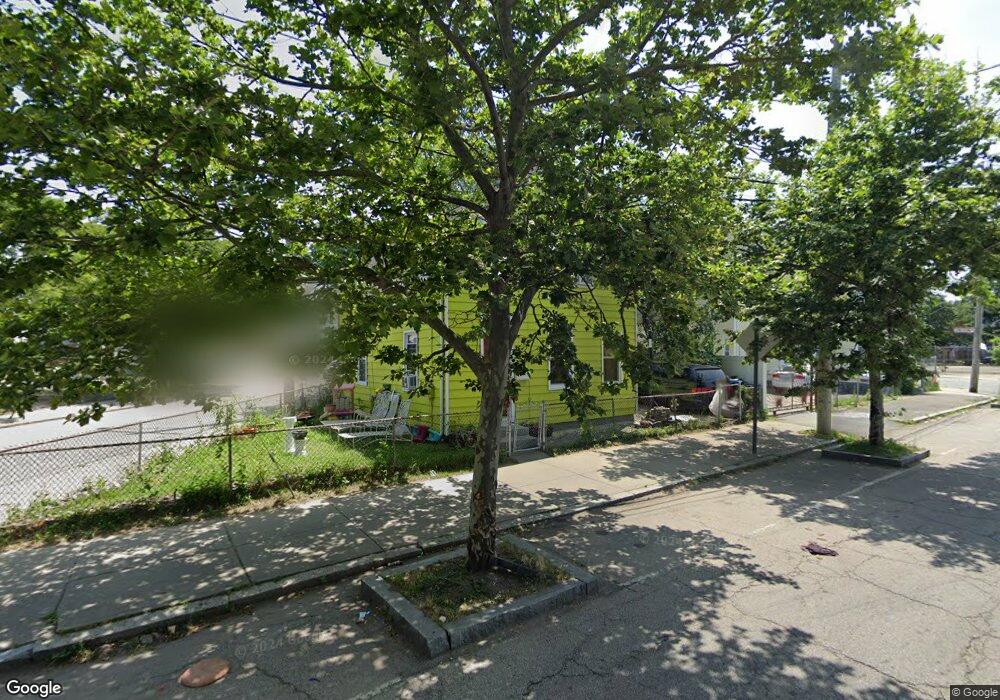
182 Messer St Providence, RI 02909
West End NeighborhoodEstimated Value: $298,000 - $403,569
3
Beds
2
Baths
992
Sq Ft
$353/Sq Ft
Est. Value
About This Home
This home is located at 182 Messer St, Providence, RI 02909 and is currently estimated at $350,392, approximately $353 per square foot. 182 Messer St is a home located in Providence County with nearby schools including Asa Messer Elementary School, Charles N. Fortes Elementary School, and Alfred Lima Sr. Elementary School.
Ownership History
Date
Name
Owned For
Owner Type
Purchase Details
Closed on
Dec 15, 2003
Sold by
Wm Specialty Mtg Llc
Bought by
Home Value Rlty & Prope
Current Estimated Value
Home Financials for this Owner
Home Financials are based on the most recent Mortgage that was taken out on this home.
Original Mortgage
$64,000
Outstanding Balance
$29,698
Interest Rate
5.9%
Mortgage Type
Purchase Money Mortgage
Estimated Equity
$320,694
Purchase Details
Closed on
Aug 18, 1989
Sold by
Ackley Byron F
Bought by
Ste Vin Realty Assoc
Create a Home Valuation Report for This Property
The Home Valuation Report is an in-depth analysis detailing your home's value as well as a comparison with similar homes in the area
Home Values in the Area
Average Home Value in this Area
Purchase History
| Date | Buyer | Sale Price | Title Company |
|---|---|---|---|
| Home Value Rlty & Prope | $54,000 | -- | |
| Ste Vin Realty Assoc | $38,500 | -- |
Source: Public Records
Mortgage History
| Date | Status | Borrower | Loan Amount |
|---|---|---|---|
| Open | Ste Vin Realty Assoc | $64,000 | |
| Previous Owner | Ste Vin Realty Assoc | $43,000 | |
| Previous Owner | Ste Vin Realty Assoc | $89,600 | |
| Previous Owner | Ste Vin Realty Assoc | $25,000 |
Source: Public Records
Tax History Compared to Growth
Tax History
| Year | Tax Paid | Tax Assessment Tax Assessment Total Assessment is a certain percentage of the fair market value that is determined by local assessors to be the total taxable value of land and additions on the property. | Land | Improvement |
|---|---|---|---|---|
| 2024 | $5,753 | $313,500 | $215,600 | $97,900 |
| 2023 | $5,753 | $313,500 | $215,600 | $97,900 |
| 2022 | $5,580 | $313,500 | $215,600 | $97,900 |
| 2021 | $3,411 | $138,900 | $83,500 | $55,400 |
| 2020 | $3,411 | $138,900 | $83,500 | $55,400 |
| 2019 | $3,411 | $138,900 | $83,500 | $55,400 |
| 2018 | $4,001 | $125,200 | $89,500 | $35,700 |
| 2017 | $4,001 | $125,200 | $89,500 | $35,700 |
| 2016 | $4,001 | $125,200 | $89,500 | $35,700 |
| 2015 | $4,094 | $123,700 | $89,500 | $34,200 |
| 2014 | $4,175 | $123,700 | $89,500 | $34,200 |
| 2013 | $4,175 | $123,700 | $89,500 | $34,200 |
Source: Public Records
Map
Nearby Homes