Estimated Value: $245,000 - $296,000
5
Beds
2
Baths
2,381
Sq Ft
$113/Sq Ft
Est. Value
About This Home
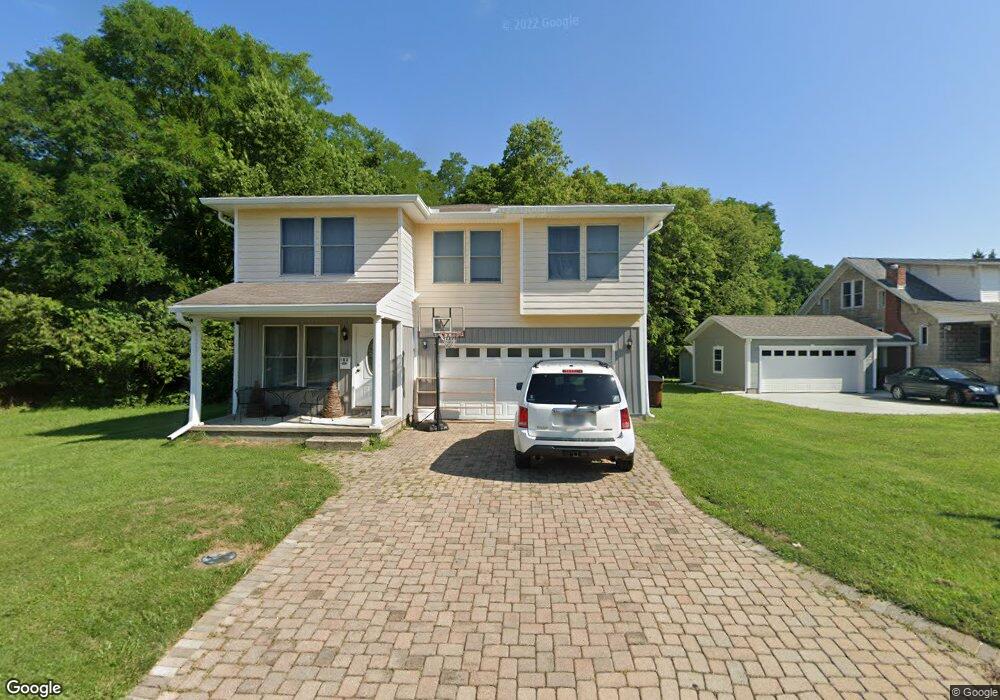
This home is located at 182 N Columbus St, Xenia, OH 45385 and is currently estimated at $268,074, approximately $112 per square foot. 182 N Columbus St is a home located in Greene County with nearby schools including Xenia High School, Summit Academy Community School for Alternative Learners - Xenia, and Legacy Christian Academy.
Ownership History
Date
Name
Owned For
Owner Type
Purchase Details
Closed on
Jul 7, 2021
Sold by
Porter Cheryl and Porter Shirley
Bought by
Grant Duane E and Grant Amanda E
Current Estimated Value
Home Financials for this Owner
Home Financials are based on the most recent Mortgage that was taken out on this home.
Original Mortgage
$173,630
Outstanding Balance
$157,686
Interest Rate
2.96%
Mortgage Type
New Conventional
Estimated Equity
$110,388
Purchase Details
Closed on
Aug 1, 2020
Sold by
Estate Of Charles W Porter
Bought by
Porter Cheryl and Porter Shirley
Purchase Details
Closed on
Jul 14, 2006
Sold by
The House Of Deliverance Church
Bought by
Porter Charles W
Purchase Details
Closed on
Sep 9, 1999
Sold by
Shaw Charlie and Shaw Nancy G
Bought by
The House Of Deliverance Church
Purchase Details
Closed on
Aug 9, 1999
Sold by
Shaw Charlie and Shaw Nancy G
Bought by
Shaw Charlie
Purchase Details
Closed on
Oct 9, 1996
Sold by
Woodson George F
Bought by
Shaw Charlie
Create a Home Valuation Report for This Property
The Home Valuation Report is an in-depth analysis detailing your home's value as well as a comparison with similar homes in the area
Home Values in the Area
Average Home Value in this Area
Purchase History
| Date | Buyer | Sale Price | Title Company |
|---|---|---|---|
| Grant Duane E | -- | None Listed On Document | |
| Porter Cheryl | -- | None Available | |
| Porter Charles W | -- | None Available | |
| The House Of Deliverance Church | -- | -- | |
| Shaw Charlie | -- | -- | |
| Shaw Charlie | $7,500 | -- |
Source: Public Records
Mortgage History
| Date | Status | Borrower | Loan Amount |
|---|---|---|---|
| Open | Grant Duane E | $173,630 |
Source: Public Records
Tax History Compared to Growth
Tax History
| Year | Tax Paid | Tax Assessment Tax Assessment Total Assessment is a certain percentage of the fair market value that is determined by local assessors to be the total taxable value of land and additions on the property. | Land | Improvement |
|---|---|---|---|---|
| 2024 | $2,971 | $69,440 | $2,240 | $67,200 |
| 2023 | $2,971 | $69,440 | $2,240 | $67,200 |
| 2022 | $2,438 | $48,600 | $2,040 | $46,560 |
| 2021 | $2,471 | $48,600 | $2,040 | $46,560 |
| 2020 | $1,890 | $48,600 | $2,040 | $46,560 |
| 2019 | $1,785 | $44,170 | $2,190 | $41,980 |
| 2018 | $1,792 | $44,170 | $2,190 | $41,980 |
| 2017 | $1,739 | $44,170 | $2,190 | $41,980 |
| 2016 | $1,724 | $42,200 | $2,190 | $40,010 |
| 2015 | $864 | $42,200 | $2,190 | $40,010 |
| 2014 | $827 | $42,200 | $2,190 | $40,010 |
Source: Public Records
Map
Nearby Homes
- 182 186 N Columbus St
- 186 N Columbus St
- 204 N Columbus St
- 191 N Columbus St
- 214 N Columbus St
- 322 E Church St
- 390 E Church St
- 318 E Church St
- 226 N Columbus St
- 143 N Columbus St
- 335 E Church St
- 369 E Church St
- 385 E Church St
- 317 E Church St
- 422 E Church St
- 323 E Church St
- 407 E Church St
- 436 E Church St
- 421 E Church St
- 260 N Columbus St