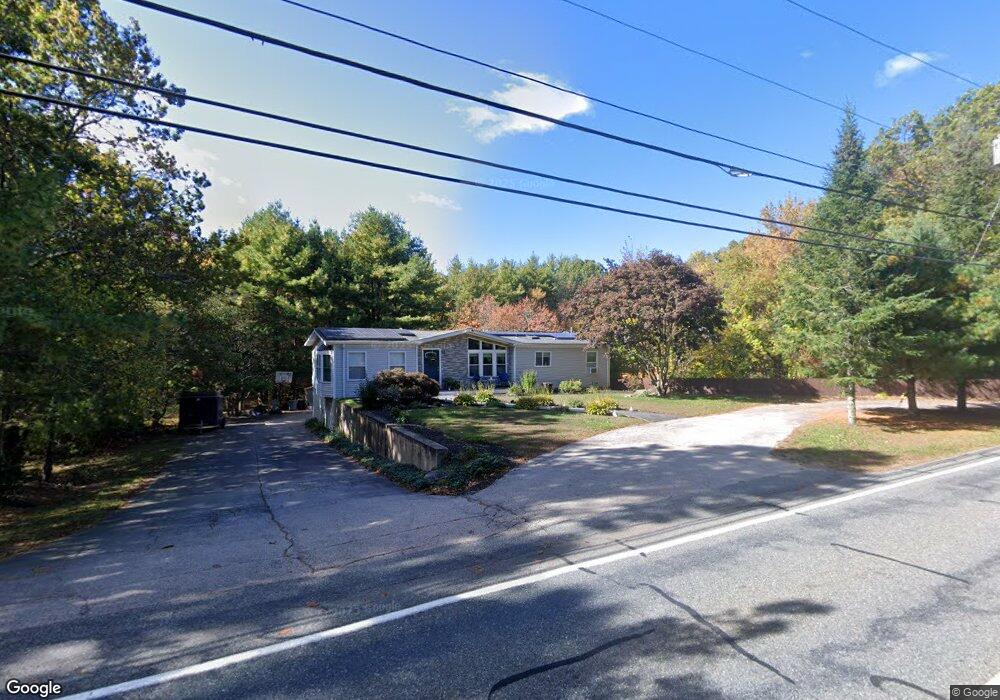
182 Plain St Rehoboth, MA 02769
Estimated Value: $524,970 - $628,000
3
Beds
2
Baths
1,526
Sq Ft
$371/Sq Ft
Est. Value
About This Home
This home is located at 182 Plain St, Rehoboth, MA 02769 and is currently estimated at $565,493, approximately $370 per square foot. 182 Plain St is a home located in Bristol County with nearby schools including Dighton-Rehoboth Regional High School.
Ownership History
Date
Name
Owned For
Owner Type
Purchase Details
Closed on
Jun 7, 2013
Sold by
Pacheco 3Rd Joseph M and Pacheco Nancy
Bought by
Palmer River Dev Co Ll
Current Estimated Value
Purchase Details
Closed on
Aug 6, 2010
Sold by
Marcotrigiano Anne and Vessella Scott
Bought by
Pacheco Joseph M and Pacheco Nancy
Home Financials for this Owner
Home Financials are based on the most recent Mortgage that was taken out on this home.
Original Mortgage
$201,801
Interest Rate
4.73%
Mortgage Type
Purchase Money Mortgage
Create a Home Valuation Report for This Property
The Home Valuation Report is an in-depth analysis detailing your home's value as well as a comparison with similar homes in the area
Home Values in the Area
Average Home Value in this Area
Purchase History
| Date | Buyer | Sale Price | Title Company |
|---|---|---|---|
| Palmer River Dev Co Ll | $8,000 | -- | |
| Pacheco Joseph M | $204,520 | -- |
Source: Public Records
Mortgage History
| Date | Status | Borrower | Loan Amount |
|---|---|---|---|
| Previous Owner | Pacheco Joseph M | $201,801 |
Source: Public Records
Tax History
| Year | Tax Paid | Tax Assessment Tax Assessment Total Assessment is a certain percentage of the fair market value that is determined by local assessors to be the total taxable value of land and additions on the property. | Land | Improvement |
|---|---|---|---|---|
| 2025 | $45 | $399,400 | $174,100 | $225,300 |
| 2024 | $4,368 | $384,500 | $174,100 | $210,400 |
| 2023 | $4,259 | $367,800 | $170,500 | $197,300 |
| 2022 | $4,242 | $334,800 | $170,500 | $164,300 |
| 2021 | $4,186 | $316,200 | $162,700 | $153,500 |
| 2020 | $3,991 | $304,200 | $162,700 | $141,500 |
| 2018 | $3,014 | $298,000 | $154,900 | $143,100 |
| 2017 | $3,343 | $266,200 | $154,900 | $111,300 |
| 2016 | $3,277 | $269,700 | $154,900 | $114,800 |
| 2015 | $3,057 | $248,300 | $147,700 | $100,600 |
| 2014 | $2,999 | $241,100 | $140,500 | $100,600 |
Source: Public Records
Map
Nearby Homes