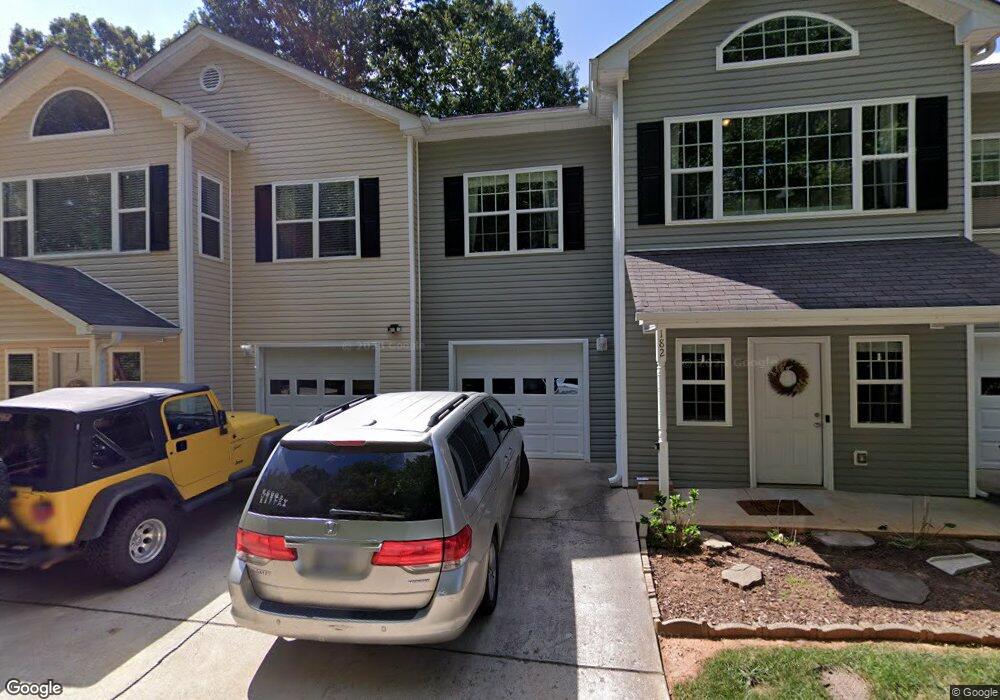
182 Pointe Cir Unit BL7-7B Dahlonega, GA 30533
Estimated Value: $287,000 - $399,000
3
Beds
3
Baths
1,855
Sq Ft
$179/Sq Ft
Est. Value
About This Home
This home is located at 182 Pointe Cir Unit BL7-7B, Dahlonega, GA 30533 and is currently estimated at $331,444, approximately $178 per square foot. 182 Pointe Cir Unit BL7-7B is a home located in Lumpkin County with nearby schools including Clay County Middle School and Lumpkin County High School.
Ownership History
Date
Name
Owned For
Owner Type
Purchase Details
Closed on
Jul 29, 2022
Sold by
Anderson James A
Bought by
Tony Anderson Rentals Llc
Current Estimated Value
Purchase Details
Closed on
Jun 16, 2022
Sold by
Anderson & Kenimer Properties Llc
Bought by
Anderson James A and Kenimer Reggie David
Purchase Details
Closed on
Apr 11, 2016
Sold by
Terrace Townhomes Llc
Bought by
Propert Anderson Kenimer
Purchase Details
Closed on
Apr 15, 2013
Sold by
182 Pointe Circle Llc
Bought by
Terrace Townhomes Llc
Purchase Details
Closed on
Jun 30, 2011
Sold by
Brubaker Dale
Bought by
182 Pointe Circle Llc
Purchase Details
Closed on
Mar 28, 2008
Sold by
Federal National Mortgage Association
Bought by
Brubaker Dale and Brubaker Sande
Purchase Details
Closed on
Feb 5, 2008
Sold by
Chase Home Finance Llc
Bought by
Federal National Mtg Associati
Purchase Details
Closed on
Jan 7, 2002
Bought by
Lock Inns Inc
Create a Home Valuation Report for This Property
The Home Valuation Report is an in-depth analysis detailing your home's value as well as a comparison with similar homes in the area
Home Values in the Area
Average Home Value in this Area
Purchase History
| Date | Buyer | Sale Price | Title Company |
|---|---|---|---|
| Tony Anderson Rentals Llc | -- | -- | |
| Anderson James A | $100,000 | -- | |
| Anderson James A | -- | -- | |
| Propert Anderson Kenimer | -- | -- | |
| Terrace Townhomes Llc | $115,000 | -- | |
| 182 Pointe Circle Llc | -- | -- | |
| Brubaker Dale | $129,900 | -- | |
| Federal National Mtg Associati | $108,371 | -- | |
| Chase Home Finance Llc | $108,371 | -- | |
| Lock Inns Inc | -- | -- |
Source: Public Records
Tax History Compared to Growth
Tax History
| Year | Tax Paid | Tax Assessment Tax Assessment Total Assessment is a certain percentage of the fair market value that is determined by local assessors to be the total taxable value of land and additions on the property. | Land | Improvement |
|---|---|---|---|---|
| 2024 | $2,588 | $109,346 | $10,000 | $99,346 |
| 2023 | $2,418 | $102,814 | $10,000 | $92,814 |
| 2022 | $2,107 | $85,097 | $6,000 | $79,097 |
| 2021 | $1,849 | $72,242 | $6,000 | $66,242 |
| 2020 | $1,705 | $64,615 | $6,000 | $58,615 |
| 2019 | $1,440 | $54,108 | $6,000 | $48,108 |
| 2018 | $1,535 | $54,108 | $6,000 | $48,108 |
| 2017 | $1,330 | $54,108 | $6,000 | $48,108 |
| 2016 | $1,498 | $50,094 | $6,000 | $44,094 |
| 2015 | $1,213 | $50,094 | $6,000 | $44,094 |
| 2014 | $1,213 | $50,578 | $6,000 | $44,578 |
| 2013 | -- | $51,062 | $6,000 | $45,062 |
Source: Public Records
Map
Nearby Homes
- 302 Pointe Cir
- 7.123 Acres Halls Mill Rd
- 03 Kate Rd
- 00 Captain McDonald Rd
- 745 Captain McDonald Rd
- 85 Summit Canyon Rd Unit H102
- 0 Winters Mountain Rd Unit 7681054
- 0 Winters Mountain Rd Unit 10643431
- 300 Mountain Ridge Dr
- 1323 Cavender Creek Rd
- 2589 Morrison Moore Pkwy E
- 00 LOT C Cavender Creek Rd
- LOT 6 Sky Country Rd
- 6480A Highway 52
- 496 Beaver Dam Rd
- 502 Wimpy Mill Rd
- 329 Morrison Moore Pkwy E
- 00 Cavender Creek Rd
- 0 Porter Springs Rd Unit 7685063
- 182 Pointe Cir Unit 7
- 182 Pointe Cir Unit BL7
- 182 Pointe Cir Unit 7b
- 188 Pointe Cir Unit 7A
- 188 Pointe Cir Unit BL7
- 176 Pointe Cir
- 176 Pointe Cir Unit 7C
- 210 Pointe Cir Unit BL6
- 156 Pointe Cir
- 216 Pointe Cir
- 150 Pointe Cir Unit 8B
- 150 Pointe Cir
- 222 Pointe Cir Unit BL6
- 222 Pointe Cir Unit 6A
- 144 Pointe Cir
- 144 Pointe Cir Unit 8C
- 266 Pointe Cir
- 272 Pointe Cir
- 278 Pointe Cir
- 278 Pointe Cir Unit 5A