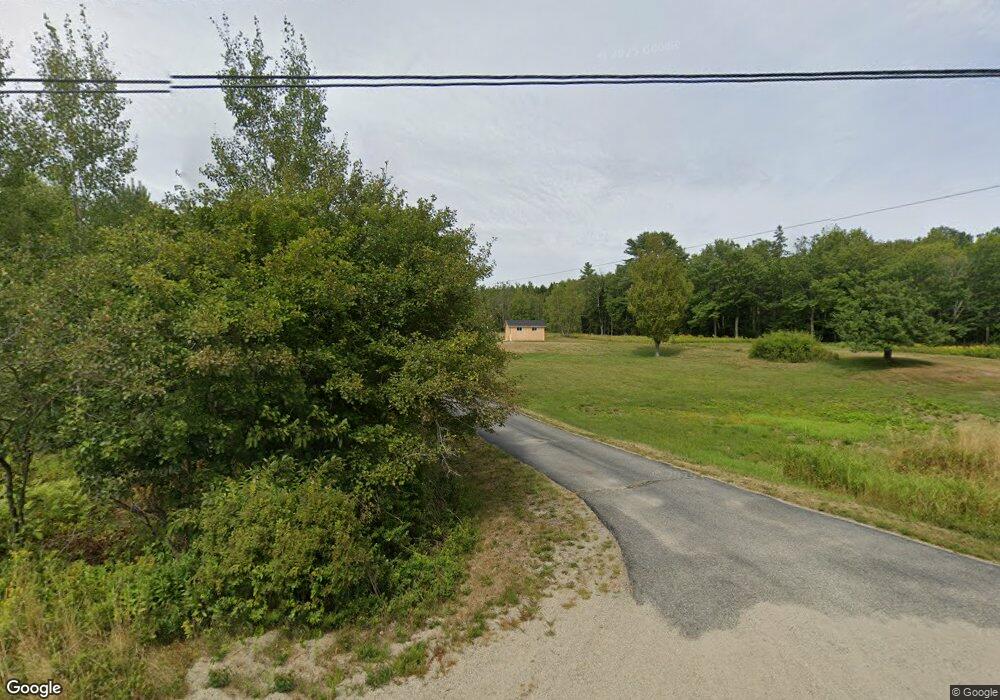
182 Ridge Rd Marshfield, ME 04654
Estimated Value: $43,048 - $353,000
2
Beds
2
Baths
1,008
Sq Ft
$146/Sq Ft
Est. Value
About This Home
This home is located at 182 Ridge Rd, Marshfield, ME 04654 and is currently estimated at $147,349, approximately $146 per square foot. 182 Ridge Rd is a home located in Washington County with nearby schools including Machias Valley Christian School.
Ownership History
Date
Name
Owned For
Owner Type
Purchase Details
Closed on
Jul 30, 2024
Sold by
Seamans Sandra Est and State Of Me Dept Of Healt
Bought by
Harris Alex S
Current Estimated Value
Purchase Details
Closed on
Sep 5, 2008
Sold by
Harmon Philip K and Harmon Robert L
Bought by
Seamans Sandra
Home Financials for this Owner
Home Financials are based on the most recent Mortgage that was taken out on this home.
Original Mortgage
$54,400
Outstanding Balance
$36,181
Interest Rate
6.69%
Mortgage Type
Purchase Money Mortgage
Estimated Equity
$111,168
Create a Home Valuation Report for This Property
The Home Valuation Report is an in-depth analysis detailing your home's value as well as a comparison with similar homes in the area
Purchase History
| Date | Buyer | Sale Price | Title Company |
|---|---|---|---|
| Harris Alex S | $35,000 | None Available | |
| Harris Alex S | $35,000 | None Available | |
| Seamans Sandra | -- | -- | |
| Seamans Sandra | -- | -- | |
| Seamans Sandra | -- | -- |
Source: Public Records
Mortgage History
| Date | Status | Borrower | Loan Amount |
|---|---|---|---|
| Open | Seamans Sandra | $54,400 | |
| Closed | Seamans Sandra | $54,400 |
Source: Public Records
Tax History
| Year | Tax Paid | Tax Assessment Tax Assessment Total Assessment is a certain percentage of the fair market value that is determined by local assessors to be the total taxable value of land and additions on the property. | Land | Improvement |
|---|---|---|---|---|
| 2024 | $585 | $34,900 | $20,600 | $14,300 |
| 2023 | $585 | $34,900 | $20,600 | $14,300 |
| 2021 | $628 | $34,900 | $20,600 | $14,300 |
| 2020 | $701 | $34,900 | $20,600 | $14,300 |
| 2019 | $576 | $34,900 | $20,600 | $14,300 |
| 2018 | $607 | $34,900 | $20,600 | $14,300 |
| 2017 | $609 | $34,900 | $20,600 | $14,300 |
| 2016 | $697 | $37,900 | $20,600 | $17,300 |
| 2015 | $667 | $37,900 | $20,600 | $17,300 |
| 2014 | $597 | $37,900 | $20,600 | $17,300 |
| 2013 | $555 | $37,900 | $20,600 | $17,300 |
Source: Public Records
Map
Nearby Homes
- Lot 48B Getchell Ln
- 22 Getchell Ln
- 32 Ridge Rd
- 1 Northfield Rd
- 0000 Northfield Rd
- 382 Ridge Rd
- 56 Cooper St
- 44 Broadway
- 33 Center St
- 11 Gardner Ave
- 29 Broadway
- Map 3 - 30 Marshfield Flats Rd
- 159 Court St
- 4 Colonial Way
- 2 High St
- 17 Northfield Rd
- 88 Water St
- 9 Grove St
- 51 Smithfield Dr
- 177 Means Cottage Rd
Your Personal Tour Guide
Ask me questions while you tour the home.