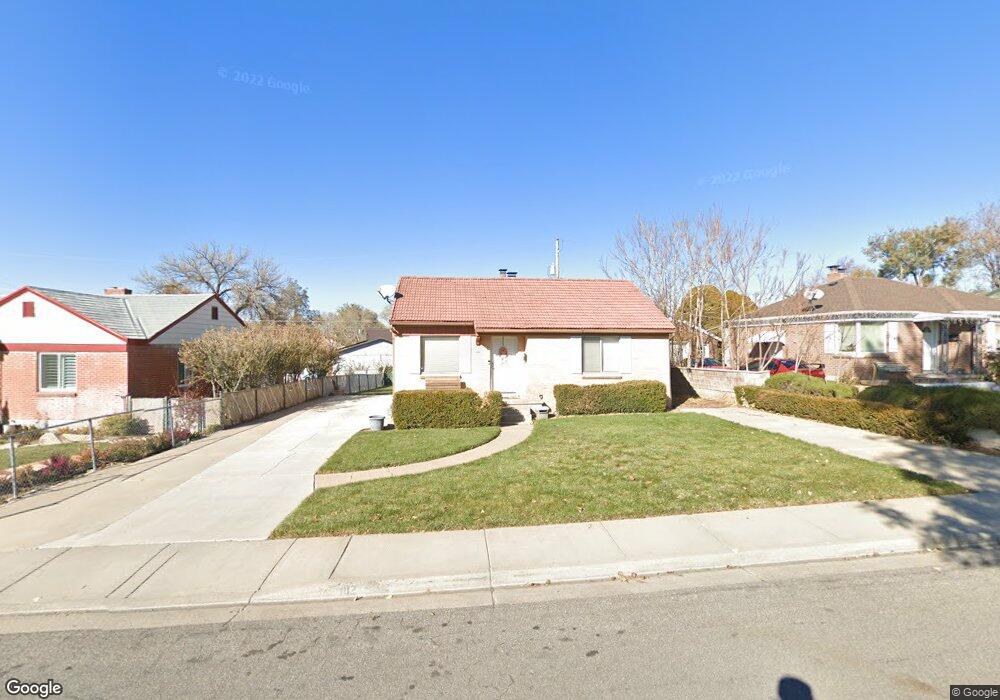
182 Ross Dr Clearfield, UT 84015
Estimated Value: $342,000 - $414,000
3
Beds
1
Bath
1,688
Sq Ft
$217/Sq Ft
Est. Value
About This Home
This home is located at 182 Ross Dr, Clearfield, UT 84015 and is currently estimated at $366,396, approximately $217 per square foot. 182 Ross Dr is a home located in Davis County with nearby schools including South Clearfield Elementary School, North Davis Junior High School, and Clearfield High School.
Ownership History
Date
Name
Owned For
Owner Type
Purchase Details
Closed on
May 27, 2014
Sold by
Green Matt and Green Lexi Jo
Bought by
Sisneros Ashlee Meghan
Current Estimated Value
Home Financials for this Owner
Home Financials are based on the most recent Mortgage that was taken out on this home.
Original Mortgage
$120,935
Outstanding Balance
$91,821
Interest Rate
4.23%
Mortgage Type
New Conventional
Estimated Equity
$274,575
Purchase Details
Closed on
Sep 11, 2013
Sold by
Green Matt
Bought by
Green Matt and Green Lexi Jo
Home Financials for this Owner
Home Financials are based on the most recent Mortgage that was taken out on this home.
Original Mortgage
$111,925
Interest Rate
4.36%
Mortgage Type
FHA
Purchase Details
Closed on
Mar 22, 2013
Sold by
Grey William J
Bought by
Bluemountain Inc
Purchase Details
Closed on
Dec 27, 2007
Sold by
Grey Robert Thurston
Bought by
Grey William J
Create a Home Valuation Report for This Property
The Home Valuation Report is an in-depth analysis detailing your home's value as well as a comparison with similar homes in the area
Home Values in the Area
Average Home Value in this Area
Purchase History
| Date | Buyer | Sale Price | Title Company |
|---|---|---|---|
| Sisneros Ashlee Meghan | -- | Security Title Of Dav | |
| Green Matt | -- | Inwest Title Services Inc | |
| Green Matt | -- | Founders Title Co | |
| Bluemountain Inc | -- | Founders Title Co L | |
| Grey William J | -- | Founders Title Co |
Source: Public Records
Mortgage History
| Date | Status | Borrower | Loan Amount |
|---|---|---|---|
| Open | Sisneros Ashlee Meghan | $120,935 | |
| Previous Owner | Green Matt | $111,925 |
Source: Public Records
Tax History
| Year | Tax Paid | Tax Assessment Tax Assessment Total Assessment is a certain percentage of the fair market value that is determined by local assessors to be the total taxable value of land and additions on the property. | Land | Improvement |
|---|---|---|---|---|
| 2025 | $1,982 | $177,650 | $64,084 | $113,566 |
| 2024 | $1,925 | $173,800 | $61,323 | $112,477 |
| 2023 | $1,732 | $287,000 | $98,911 | $188,089 |
| 2022 | $1,896 | $169,950 | $57,500 | $112,450 |
| 2021 | $1,773 | $240,000 | $57,111 | $182,889 |
| 2020 | $1,562 | $210,000 | $47,331 | $162,669 |
| 2019 | $1,424 | $189,000 | $52,228 | $136,772 |
| 2018 | $1,276 | $165,000 | $44,040 | $120,960 |
| 2016 | $1,001 | $67,650 | $18,258 | $49,392 |
| 2015 | $948 | $61,105 | $18,258 | $42,847 |
| 2014 | $836 | $54,604 | $18,258 | $36,346 |
| 2013 | -- | $49,726 | $23,023 | $26,703 |
Source: Public Records
Map
Nearby Homes
- 564 S 800 E
- 582 E 350 S
- 490 E 700 S Unit 524
- 490 E 700 S Unit C36
- 490 E 700 S Unit A2
- 490 E 700 S Unit D39
- 490 E 700 S Unit D42
- 490 E 700 S Unit D43
- 462 E London Way Unit 30
- 908 S 550 E
- 549 S 450 E
- 421 E Penny Ln
- 833 S Cowans Ct
- 458 E Depot St
- 277 S 500 E
- 35 Airlane Dr
- 462 E 625 S
- 875 S Depot St Unit C307
- 875 S Depot St Unit A335
- 875 S Depot St Unit C301
Your Personal Tour Guide
Ask me questions while you tour the home.