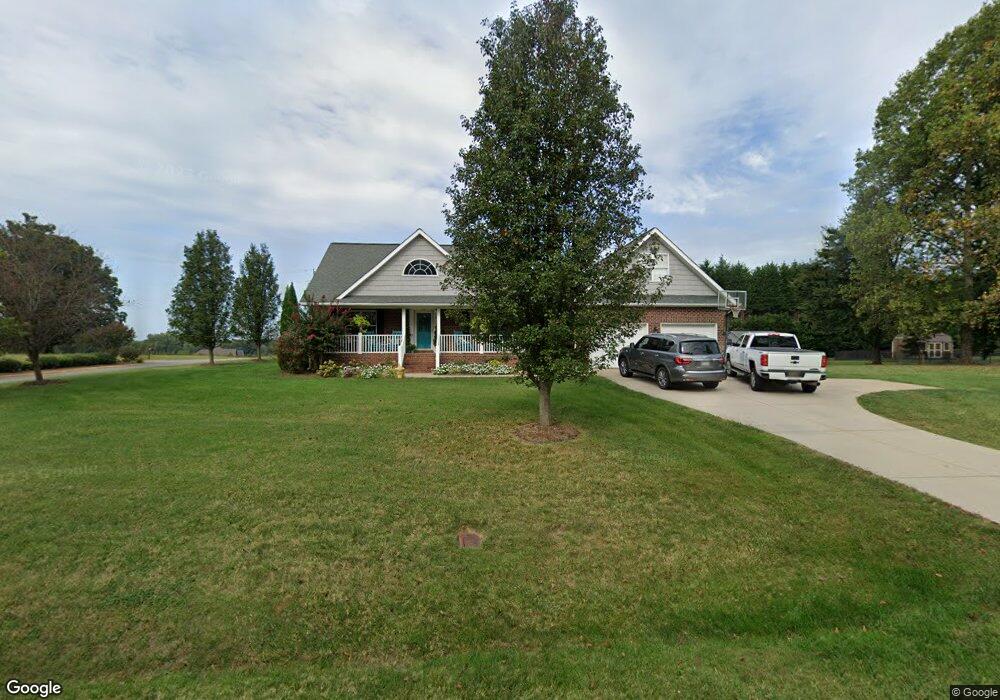
182 Skyland Dr Statesville, NC 28625
Estimated Value: $360,974 - $440,000
3
Beds
2
Baths
1,926
Sq Ft
$209/Sq Ft
Est. Value
About This Home
This home is located at 182 Skyland Dr, Statesville, NC 28625 and is currently estimated at $403,494, approximately $209 per square foot. 182 Skyland Dr is a home located in Iredell County with nearby schools including East Iredell Elementary School, East Iredell Middle School, and North Iredell High School.
Ownership History
Date
Name
Owned For
Owner Type
Purchase Details
Closed on
Jun 27, 2014
Sold by
The Finished Touch Inc
Bought by
Smith David M and Smith Tracy D
Current Estimated Value
Home Financials for this Owner
Home Financials are based on the most recent Mortgage that was taken out on this home.
Original Mortgage
$200,000
Outstanding Balance
$152,949
Interest Rate
4.5%
Mortgage Type
Adjustable Rate Mortgage/ARM
Estimated Equity
$250,546
Purchase Details
Closed on
Sep 27, 2006
Sold by
Ard Investments Inc
Bought by
The Finished Touch Inc
Home Financials for this Owner
Home Financials are based on the most recent Mortgage that was taken out on this home.
Original Mortgage
$300,000
Interest Rate
6.48%
Mortgage Type
Construction
Create a Home Valuation Report for This Property
The Home Valuation Report is an in-depth analysis detailing your home's value as well as a comparison with similar homes in the area
Home Values in the Area
Average Home Value in this Area
Purchase History
| Date | Buyer | Sale Price | Title Company |
|---|---|---|---|
| Smith David M | $200,000 | None Available | |
| The Finished Touch Inc | $45,000 | None Available |
Source: Public Records
Mortgage History
| Date | Status | Borrower | Loan Amount |
|---|---|---|---|
| Open | Smith David M | $200,000 | |
| Previous Owner | The Finished Touch Inc | $300,000 |
Source: Public Records
Tax History Compared to Growth
Tax History
| Year | Tax Paid | Tax Assessment Tax Assessment Total Assessment is a certain percentage of the fair market value that is determined by local assessors to be the total taxable value of land and additions on the property. | Land | Improvement |
|---|---|---|---|---|
| 2025 | $1,820 | $298,360 | $36,000 | $262,360 |
| 2024 | $1,820 | $298,360 | $36,000 | $262,360 |
| 2023 | $1,820 | $298,360 | $36,000 | $262,360 |
| 2022 | $1,529 | $234,180 | $36,000 | $198,180 |
| 2021 | $1,525 | $234,180 | $36,000 | $198,180 |
| 2020 | $1,525 | $234,180 | $36,000 | $198,180 |
| 2019 | $1,502 | $234,180 | $36,000 | $198,180 |
| 2018 | $1,243 | $199,360 | $22,000 | $177,360 |
| 2017 | $1,243 | $199,360 | $22,000 | $177,360 |
| 2016 | $1,243 | $199,360 | $22,000 | $177,360 |
| 2015 | $1,229 | $197,060 | $22,000 | $175,060 |
| 2014 | -- | $208,810 | $22,000 | $186,810 |
Source: Public Records
Map
Nearby Homes
- 135 Carters Farm Dr
- 154 Carters Farm Dr
- 605 Saint Cloud Dr
- 522 Saint Cloud Dr
- 720 Saint Cloud Dr
- 0 Bell Farm Rd
- 627 Saint Andrews Rd
- 625 Saint Andrews Rd
- 000 Saint Andrews Place
- 615 Bell Farm Rd
- 3229 Broadmoor Dr
- 629 Saint Andrews Rd
- Lot 368 Camden Rd
- Lot 370 Camden Rd
- Lot 371 Camden Rd
- L367 Camden Rd
- 199 Bell Farm Rd
- 174 Birchwood Rd Unit 24
- 182 Bellwood Loop Unit 22
- 517 Augusta Dr
- LT 42 Carters Farm Dr
- 000 Carters Farm Dr
- 000 Carters Farm Dr Unit 42
- 174 Skyland Dr
- 104 Capstone Ct
- LT 43 Carters Farm Dr
- Lot 3 Carters Farm Dr
- 110 Capstone Ct
- LT 13 Winfield Place
- LT 15 Winfield Place
- 187 Skyland Dr
- 173 Skyland Dr
- 116 Capstone Ct
- 166 Skyland Dr
- 115 Carters Farm Dr
- 105 Capstone Ct Unit 8
- 105 Capstone Ct
- 165 Skyland Dr
- 158 Skyland Dr
- 120 Capstone Ct