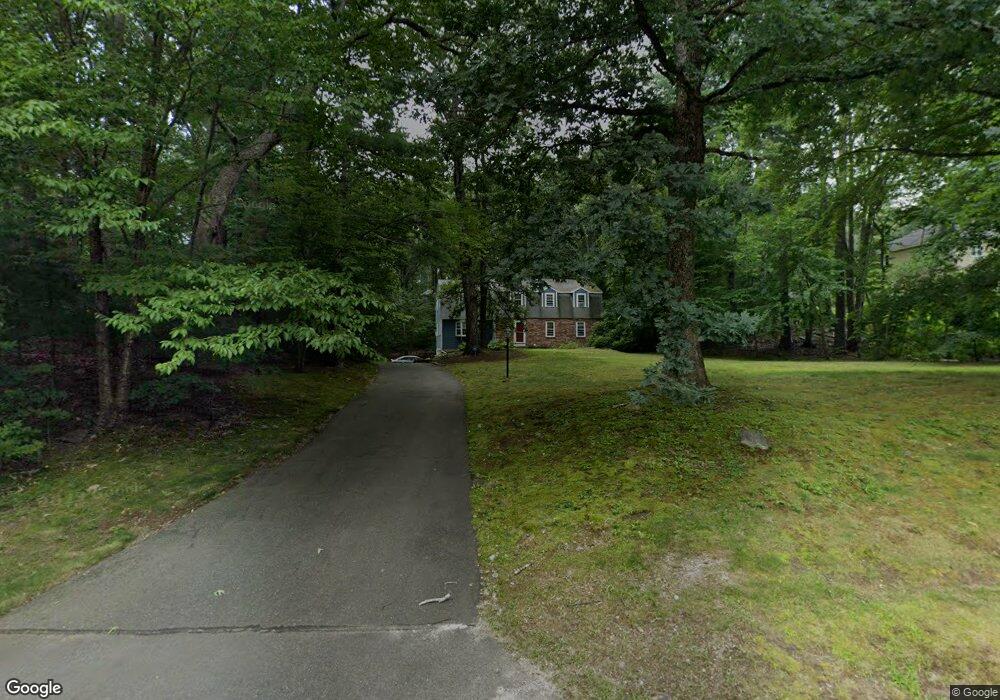
182 Vega Rd Marlborough, MA 01752
Estimated Value: $806,000 - $946,000
4
Beds
3
Baths
2,544
Sq Ft
$340/Sq Ft
Est. Value
About This Home
This home is located at 182 Vega Rd, Marlborough, MA 01752 and is currently estimated at $865,721, approximately $340 per square foot. 182 Vega Rd is a home located in Middlesex County with nearby schools including Marlborough High School, New Covenant Christian School, and Glenhaven Academy - JRI School.
Ownership History
Date
Name
Owned For
Owner Type
Purchase Details
Closed on
Jun 27, 1991
Sold by
Troy Gino and Troy Donna S
Bought by
Sher Barbra E and Pastor Edward J
Current Estimated Value
Home Financials for this Owner
Home Financials are based on the most recent Mortgage that was taken out on this home.
Original Mortgage
$191,250
Interest Rate
9.44%
Mortgage Type
Purchase Money Mortgage
Create a Home Valuation Report for This Property
The Home Valuation Report is an in-depth analysis detailing your home's value as well as a comparison with similar homes in the area
Home Values in the Area
Average Home Value in this Area
Purchase History
| Date | Buyer | Sale Price | Title Company |
|---|---|---|---|
| Sher Barbra E | $222,500 | -- |
Source: Public Records
Mortgage History
| Date | Status | Borrower | Loan Amount |
|---|---|---|---|
| Open | Sher Barbra E | $129,000 | |
| Closed | Sher Barbra E | $190,000 | |
| Closed | Sher Barbra E | $190,400 | |
| Closed | Sher Barbra E | $191,250 |
Source: Public Records
Tax History Compared to Growth
Tax History
| Year | Tax Paid | Tax Assessment Tax Assessment Total Assessment is a certain percentage of the fair market value that is determined by local assessors to be the total taxable value of land and additions on the property. | Land | Improvement |
|---|---|---|---|---|
| 2025 | $7,043 | $714,300 | $250,300 | $464,000 |
| 2024 | $6,801 | $664,200 | $227,400 | $436,800 |
| 2023 | $7,210 | $624,800 | $187,400 | $437,400 |
| 2022 | $6,993 | $533,000 | $178,700 | $354,300 |
| 2021 | $6,812 | $493,600 | $149,100 | $344,500 |
| 2020 | $6,692 | $471,900 | $142,100 | $329,800 |
| 2019 | $6,329 | $464,200 | $139,500 | $324,700 |
| 2018 | $6,605 | $451,500 | $128,600 | $322,900 |
| 2017 | $6,621 | $432,200 | $130,800 | $301,400 |
| 2016 | $6,470 | $421,800 | $130,800 | $291,000 |
| 2015 | $6,733 | $427,200 | $141,000 | $286,200 |
Source: Public Records
Map
Nearby Homes