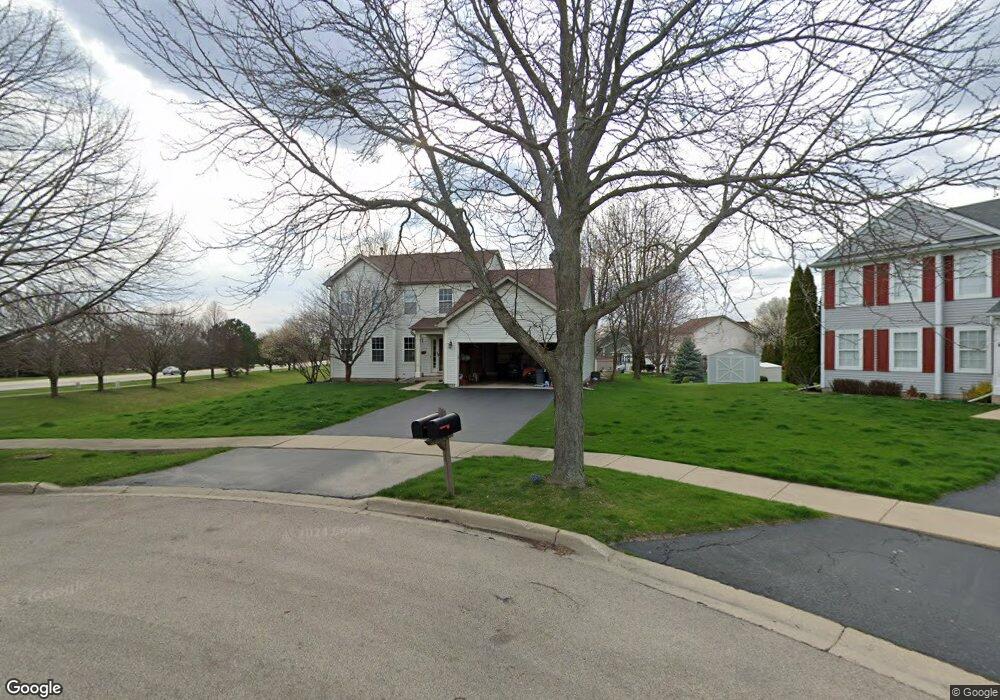
182 White Oak Dr North Aurora, IL 60542
Estimated Value: $433,000 - $465,206
4
Beds
4
Baths
2,372
Sq Ft
$188/Sq Ft
Est. Value
About This Home
This home is located at 182 White Oak Dr, North Aurora, IL 60542 and is currently estimated at $446,552, approximately $188 per square foot. 182 White Oak Dr is a home located in Kane County with nearby schools including Fearn Elementary School, Jewel Middle School, and West Aurora High School.
Ownership History
Date
Name
Owned For
Owner Type
Purchase Details
Closed on
Oct 22, 2012
Sold by
Gray Laura M
Bought by
Gray Laura M
Current Estimated Value
Home Financials for this Owner
Home Financials are based on the most recent Mortgage that was taken out on this home.
Original Mortgage
$180,000
Outstanding Balance
$123,819
Interest Rate
3.37%
Mortgage Type
New Conventional
Estimated Equity
$322,733
Purchase Details
Closed on
Jun 23, 1999
Sold by
Waterford Homes Inc
Bought by
Gray Paul E and Gray Laura M
Home Financials for this Owner
Home Financials are based on the most recent Mortgage that was taken out on this home.
Original Mortgage
$165,000
Interest Rate
7.29%
Create a Home Valuation Report for This Property
The Home Valuation Report is an in-depth analysis detailing your home's value as well as a comparison with similar homes in the area
Home Values in the Area
Average Home Value in this Area
Purchase History
| Date | Buyer | Sale Price | Title Company |
|---|---|---|---|
| Gray Laura M | -- | Fidelity National Title Insu | |
| Gray Paul E | $185,000 | First American Title Ins Co | |
| Waterford Homes Inc | -- | First American Title Ins Co |
Source: Public Records
Mortgage History
| Date | Status | Borrower | Loan Amount |
|---|---|---|---|
| Open | Gray Laura M | $180,000 | |
| Closed | Gray Paul E | $165,000 |
Source: Public Records
Tax History Compared to Growth
Tax History
| Year | Tax Paid | Tax Assessment Tax Assessment Total Assessment is a certain percentage of the fair market value that is determined by local assessors to be the total taxable value of land and additions on the property. | Land | Improvement |
|---|---|---|---|---|
| 2024 | $9,883 | $136,099 | $23,352 | $112,747 |
| 2023 | $9,477 | $121,604 | $20,865 | $100,739 |
| 2022 | $8,904 | $110,952 | $19,037 | $91,915 |
| 2021 | $8,454 | $103,298 | $17,724 | $85,574 |
| 2020 | $8,960 | $107,247 | $16,463 | $90,784 |
| 2019 | $8,689 | $99,367 | $15,253 | $84,114 |
| 2018 | $8,483 | $94,105 | $14,109 | $79,996 |
| 2017 | $8,557 | $92,672 | $16,238 | $76,434 |
| 2016 | $8,820 | $92,652 | $13,919 | $78,733 |
| 2015 | -- | $79,323 | $11,969 | $67,354 |
| 2014 | -- | $76,088 | $11,512 | $64,576 |
| 2013 | -- | $77,126 | $11,348 | $65,778 |
Source: Public Records
Map
Nearby Homes
- 201 Hidden Creek Ln Unit 301
- 311 Hidden Creek Ln Unit 311
- 71 Windstone Dr
- 1640 Abington Ln
- 1202 Fox Hill Ln Unit 362
- 1403 Prairie Ct
- 413 Messenger Cir
- 109 E Victoria Cir Unit 7/5
- 203 E Victoria Cir Unit 9/2
- 316 E Victoria Cir Unit 125
- 420 Hidden Creek Ln Unit 65
- 1432 Hartsburg Ln Unit 1
- Lot 16 West Orchard Gateway Blvd
- Lot 1 North Orchard Gateway Blvd
- Lot 16 Orchard Gateway Blvd
- Lot 6 Towne Center Dr
- Lot 13 Towne Center Dr
- Lot 1 South Towne Center Dr
- Lot 5 Towne Center Dr
- 1638 Patterson Ave
- 190 White Oak Dr
- 1470 Westbury Cir
- 1478 Westbury Cir
- 198 White Oak Dr
- 1486 Westbury Cir
- 1462 Westbury Cir
- 206 White Oak Dr
- 1494 Westbury Cir
- 199 White Oak Dr
- 1454 Westbury Cir
- 124 Oak Hill Ct
- 132 Oak Hill Ct
- 1392 Hearthstone Ln
- 1489 Westbury Cir
- 1502 Westbury Cir
- 209 Spring Ct
- 214 White Oak Dr
- 1384 Hearthstone Ln
- 1446 Westbury Cir
- 175 White Oak Dr