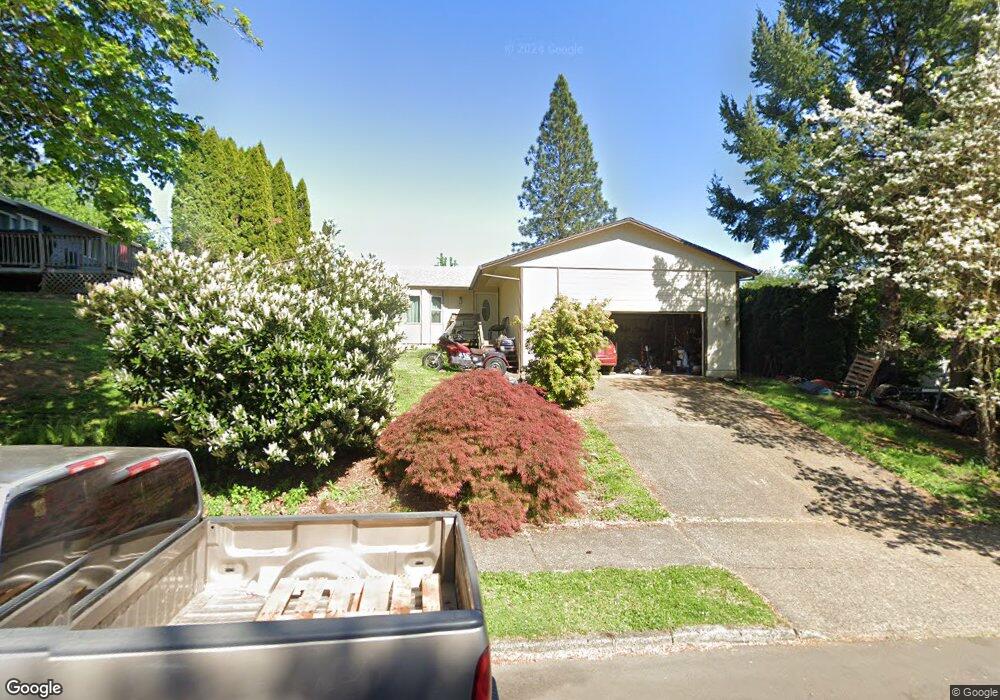
1820 37th St Washougal, WA 98671
Estimated Value: $455,723 - $473,000
3
Beds
3
Baths
1,246
Sq Ft
$372/Sq Ft
Est. Value
About This Home
This home is located at 1820 37th St, Washougal, WA 98671 and is currently estimated at $463,431, approximately $371 per square foot. 1820 37th St is a home located in Clark County with nearby schools including Gause Elementary School, Jemtegaard Middle School, and Washougal High School.
Ownership History
Date
Name
Owned For
Owner Type
Purchase Details
Closed on
Dec 7, 2018
Sold by
White Jeffrey S
Bought by
White Kevin D
Current Estimated Value
Home Financials for this Owner
Home Financials are based on the most recent Mortgage that was taken out on this home.
Original Mortgage
$265,168
Outstanding Balance
$233,619
Interest Rate
4.8%
Mortgage Type
VA
Estimated Equity
$229,812
Purchase Details
Closed on
Oct 7, 1999
Sold by
White Sherry A
Bought by
White Jeffery G
Purchase Details
Closed on
Apr 13, 1998
Sold by
Rolf David E and Rolf Dondi Lyn
Bought by
White Jeff S and White Sherry A
Home Financials for this Owner
Home Financials are based on the most recent Mortgage that was taken out on this home.
Original Mortgage
$121,100
Interest Rate
7.18%
Create a Home Valuation Report for This Property
The Home Valuation Report is an in-depth analysis detailing your home's value as well as a comparison with similar homes in the area
Home Values in the Area
Average Home Value in this Area
Purchase History
| Date | Buyer | Sale Price | Title Company |
|---|---|---|---|
| White Kevin D | $275,000 | Wfg National Title Co | |
| White Jeffery G | -- | -- | |
| White Jeff S | $127,500 | Chicago Title Insurance Co |
Source: Public Records
Mortgage History
| Date | Status | Borrower | Loan Amount |
|---|---|---|---|
| Open | White Kevin D | $265,168 | |
| Previous Owner | White Jeff S | $121,100 |
Source: Public Records
Tax History Compared to Growth
Tax History
| Year | Tax Paid | Tax Assessment Tax Assessment Total Assessment is a certain percentage of the fair market value that is determined by local assessors to be the total taxable value of land and additions on the property. | Land | Improvement |
|---|---|---|---|---|
| 2025 | $3,252 | $331,380 | $120,000 | $211,380 |
| 2024 | $3,308 | $342,540 | $144,000 | $198,540 |
| 2023 | $3,215 | $364,582 | $154,800 | $209,782 |
| 2022 | $3,165 | $347,056 | $154,800 | $192,256 |
| 2021 | $3,014 | $296,478 | $132,000 | $164,478 |
| 2020 | $2,924 | $265,010 | $120,000 | $145,010 |
| 2019 | $2,498 | $261,209 | $120,000 | $141,209 |
| 2018 | $2,614 | $235,861 | $0 | $0 |
| 2017 | $2,328 | $203,701 | $0 | $0 |
| 2016 | $2,259 | $199,258 | $0 | $0 |
| 2015 | $2,186 | $176,856 | $0 | $0 |
| 2014 | -- | $170,263 | $0 | $0 |
| 2013 | -- | $152,311 | $0 | $0 |
Source: Public Records
Map
Nearby Homes