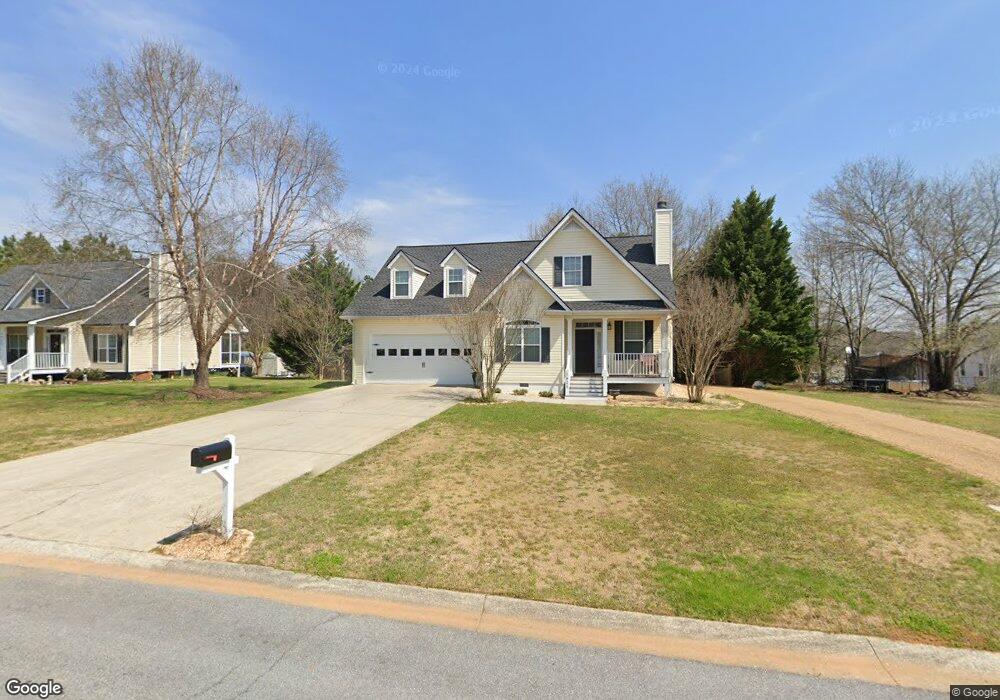
1820 Calloway Path Rockmart, GA 30153
Estimated Value: $294,000 - $335,000
3
Beds
3
Baths
1,675
Sq Ft
$184/Sq Ft
Est. Value
About This Home
This home is located at 1820 Calloway Path, Rockmart, GA 30153 and is currently estimated at $307,847, approximately $183 per square foot. 1820 Calloway Path is a home located in Polk County with nearby schools including Rockmart Middle School.
Ownership History
Date
Name
Owned For
Owner Type
Purchase Details
Closed on
Oct 15, 2014
Sold by
Christopher Rix and Christopher Stefanie
Bought by
Rix Christopher
Current Estimated Value
Purchase Details
Closed on
Oct 19, 2007
Sold by
Rix Christopher
Bought by
Rix Christopher and Rix Stefanie
Home Financials for this Owner
Home Financials are based on the most recent Mortgage that was taken out on this home.
Original Mortgage
$150,800
Interest Rate
6.27%
Mortgage Type
New Conventional
Purchase Details
Closed on
Oct 17, 2005
Sold by
Forsyth Jon
Bought by
Rix Christopher
Home Financials for this Owner
Home Financials are based on the most recent Mortgage that was taken out on this home.
Original Mortgage
$116,720
Interest Rate
5.71%
Mortgage Type
New Conventional
Purchase Details
Closed on
Apr 16, 2004
Sold by
Dan Forsyth Agency Inc
Bought by
Forsyth Jon
Create a Home Valuation Report for This Property
The Home Valuation Report is an in-depth analysis detailing your home's value as well as a comparison with similar homes in the area
Home Values in the Area
Average Home Value in this Area
Purchase History
| Date | Buyer | Sale Price | Title Company |
|---|---|---|---|
| Rix Christopher | -- | -- | |
| Rix Christopher | -- | -- | |
| Rix Christopher | $145,900 | -- | |
| Forsyth Jon | -- | -- |
Source: Public Records
Mortgage History
| Date | Status | Borrower | Loan Amount |
|---|---|---|---|
| Previous Owner | Rix Christopher | $150,800 | |
| Previous Owner | Rix Christopher | $116,720 | |
| Previous Owner | Rix Christopher | $29,180 |
Source: Public Records
Tax History
| Year | Tax Paid | Tax Assessment Tax Assessment Total Assessment is a certain percentage of the fair market value that is determined by local assessors to be the total taxable value of land and additions on the property. | Land | Improvement |
|---|---|---|---|---|
| 2025 | $3,440 | $115,640 | $12,000 | $103,640 |
| 2024 | $3,251 | $115,640 | $12,000 | $103,640 |
| 2023 | $2,393 | $76,142 | $10,000 | $66,142 |
| 2022 | $1,538 | $66,802 | $10,000 | $56,802 |
| 2021 | $1,558 | $66,802 | $10,000 | $56,802 |
| 2020 | $1,561 | $66,802 | $10,000 | $56,802 |
| 2019 | $1,464 | $56,531 | $7,200 | $49,331 |
| 2018 | $1,418 | $53,448 | $7,200 | $46,248 |
| 2017 | $1,400 | $53,448 | $7,200 | $46,248 |
| 2016 | $1,400 | $53,448 | $7,200 | $46,248 |
| 2015 | $1,408 | $53,598 | $7,200 | $46,398 |
| 2014 | $1,419 | $53,598 | $7,200 | $46,398 |
Source: Public Records
Map
Nearby Homes
- 740 Calloway Dr
- 702 Calloway Dr
- 1714 Cedartown Hwy
- 506 Prospect Rd
- 722 Prospect Rd
- 0 Pine Mountain St Unit 10620510
- 0 Pine Mountain St Unit 10620492
- 92 Autumn Path
- 11 Lee St
- 135 2nd St
- 60 Lee St
- 1 Pine Mountain Rd
- 479 Morgan Valley Rd
- 214 Horseshoe Cir
- 202 Gordon St
- 00 Nathan Dean Pkwy
- 2979 Nathan Dean Pkwy
- 0 Nathan Dean Pkwy Unit 10366146
- 94 Eastwood Path
- 329 Gordon St
- 1822 Calloway Path
- 1818 Calloway Path
- 1816 Calloway Path
- 1829 Calloway Path
- 543 Calloway Terrace
- 1907 Calloway Trail
- 1812 Calloway Path
- 1823 Calloway Path
- 744 Calloway Dr
- 746 Calloway Dr
- 1909 Calloway Trail
- 548 Calloway Terrace
- 545 Calloway Terrace
- 550 Calloway Terrace
- 1810 Calloway Path
- 552 Calloway Terrace
- 738 Calloway Dr
- 1815 Calloway Path
- 732 Calloway Dr
- 542 Calloway Terrace
Your Personal Tour Guide
Ask me questions while you tour the home.