1820 King Ave Columbus, OH 43212
Estimated Value: $740,000 - $965,481
3
Beds
2
Baths
2,243
Sq Ft
$363/Sq Ft
Est. Value
About This Home
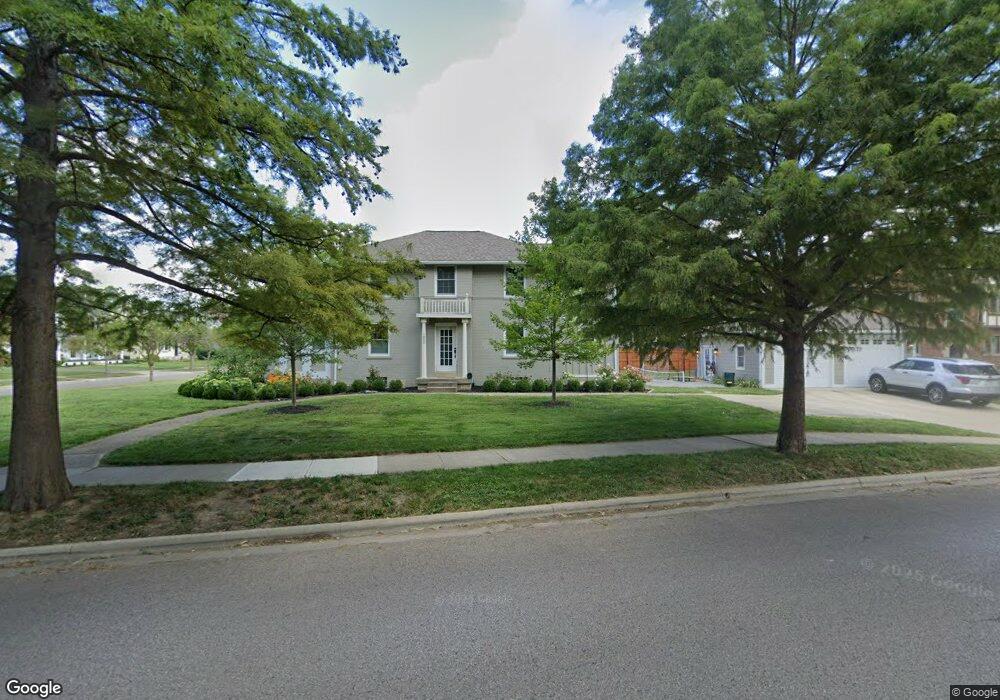
This home is located at 1820 King Ave, Columbus, OH 43212 and is currently estimated at $814,870, approximately $363 per square foot. 1820 King Ave is a home located in Franklin County with nearby schools including Barrington Road Elementary School, Jones Middle School, and Upper Arlington High School.
Ownership History
Date
Name
Owned For
Owner Type
Purchase Details
Closed on
Oct 14, 2021
Sold by
Carl Deric M and Carl Anna
Bought by
Carl Deric M and Carl Anna
Current Estimated Value
Home Financials for this Owner
Home Financials are based on the most recent Mortgage that was taken out on this home.
Original Mortgage
$230,000
Outstanding Balance
$194,477
Interest Rate
2.8%
Mortgage Type
New Conventional
Estimated Equity
$620,393
Purchase Details
Closed on
Sep 23, 2021
Sold by
Carl Deric M
Bought by
Carl Deric M and Carl Anna
Home Financials for this Owner
Home Financials are based on the most recent Mortgage that was taken out on this home.
Original Mortgage
$230,000
Outstanding Balance
$194,477
Interest Rate
2.8%
Mortgage Type
New Conventional
Estimated Equity
$620,393
Purchase Details
Closed on
Jun 30, 2009
Sold by
Hottinger Karen C and Hottinger Cesar Terry
Bought by
Carl Deric M
Home Financials for this Owner
Home Financials are based on the most recent Mortgage that was taken out on this home.
Original Mortgage
$238,598
Interest Rate
4.86%
Mortgage Type
FHA
Purchase Details
Closed on
Feb 13, 2003
Sold by
Estate Of Gloria H Cesar
Bought by
Hottinger Karen C and Hottinger Cesar Terry
Purchase Details
Closed on
Jan 26, 1990
Bought by
Cesar Gloria H
Purchase Details
Closed on
Dec 18, 1989
Create a Home Valuation Report for This Property
The Home Valuation Report is an in-depth analysis detailing your home's value as well as a comparison with similar homes in the area
Home Values in the Area
Average Home Value in this Area
Purchase History
| Date | Buyer | Sale Price | Title Company |
|---|---|---|---|
| Carl Deric M | -- | Prominent Title Agency | |
| Carl Deric M | -- | Prominent Title | |
| Carl Deric M | $243,000 | Talon Group | |
| Hottinger Karen C | -- | -- | |
| Cesar Gloria H | -- | -- | |
| -- | -- | -- |
Source: Public Records
Mortgage History
| Date | Status | Borrower | Loan Amount |
|---|---|---|---|
| Open | Carl Deric M | $230,000 | |
| Closed | Carl Deric M | $230,000 | |
| Previous Owner | Carl Deric M | $238,598 |
Source: Public Records
Tax History Compared to Growth
Tax History
| Year | Tax Paid | Tax Assessment Tax Assessment Total Assessment is a certain percentage of the fair market value that is determined by local assessors to be the total taxable value of land and additions on the property. | Land | Improvement |
|---|---|---|---|---|
| 2024 | $16,790 | $286,410 | $132,200 | $154,210 |
| 2023 | $16,376 | $286,410 | $132,200 | $154,210 |
| 2022 | $16,641 | $238,140 | $82,390 | $155,750 |
| 2021 | $14,646 | $234,050 | $82,390 | $151,660 |
| 2020 | $14,518 | $234,050 | $82,390 | $151,660 |
| 2019 | $14,775 | $210,630 | $82,390 | $128,240 |
| 2018 | $10,517 | $206,990 | $82,390 | $124,600 |
| 2017 | $10,224 | $188,830 | $82,390 | $106,440 |
| 2016 | $7,355 | $109,730 | $58,140 | $51,590 |
| 2015 | $6,761 | $100,840 | $58,140 | $42,700 |
| 2014 | $6,760 | $102,210 | $58,140 | $44,070 |
| 2013 | $3,600 | $102,200 | $58,135 | $44,065 |
Source: Public Records
Map
Nearby Homes
- 1782 Wyandotte Rd
- 1733 Elmwood Ave
- 1561 Glenn Ave
- 1661 Ashland Ave Unit 663
- 2015 W 5th Ave Unit 211
- 2015 W 5th Ave Unit 102
- 2015 W 5th Ave Unit 108
- 1631 Roxbury Rd Unit F3
- 1631 Roxbury Rd Unit B6
- 1914 Elmwood Ave
- 1459 Elmwood Ave Unit 1459
- 2110 Northwest Blvd
- 1398 Lower Green Cir Unit 1398
- 1313 Lincoln Rd
- 1364 W 7th Ave
- 00 W 7th Ave
- 1475 W 3rd Ave Unit 204
- 1535 Doone Rd
- 1869 Tewksbury Rd
- 1565 Berkshire Rd
- 1748 Andover Rd
- 1754 Andover Rd
- 1827 King Ave
- 1764 Andover Rd
- 1743 Andover Rd
- 1753 Andover Rd
- 1716 Andover Rd
- 1759 Andover Rd
- 1755 Wyandotte Rd
- 1869 King Ave
- 1770 Andover Rd
- 1765 Andover Rd
- 1761 Wyandotte Rd
- 1719 Andover Rd
- 1773 Andover Rd
- 1776 Andover Rd
- 1760 Bedford Rd
- 1700 Andover Rd
- 1768 Bedford Rd
- 1866 King Ave