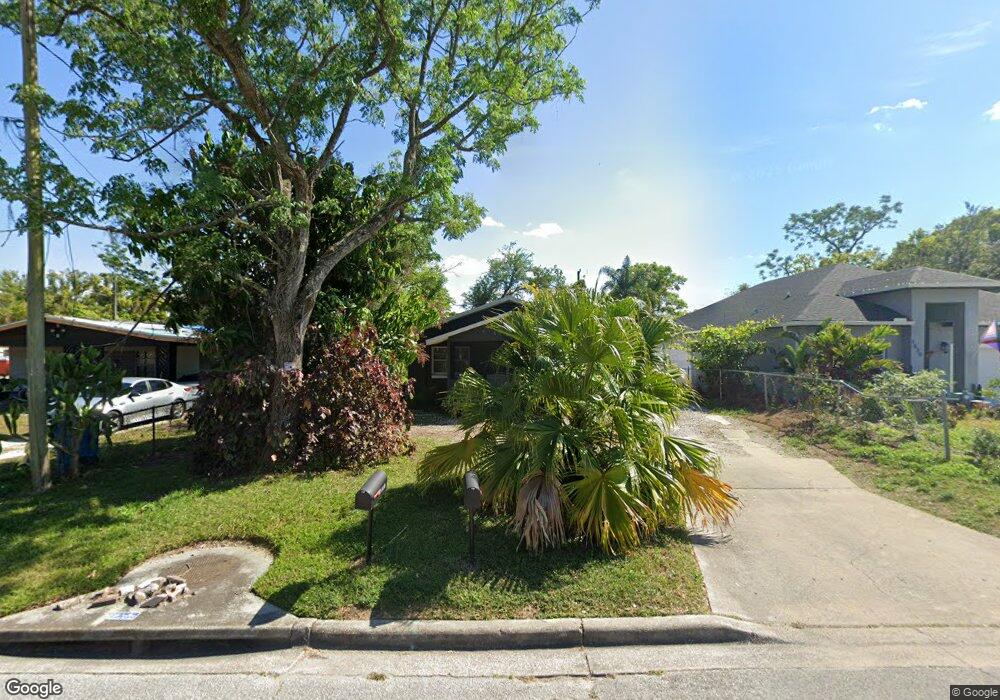
1820 Rogers Ave Unit A Maitland, FL 32751
Estimated Value: $310,873 - $465,000
4
Beds
2
Baths
1,380
Sq Ft
$282/Sq Ft
Est. Value
About This Home
This home is located at 1820 Rogers Ave Unit A, Maitland, FL 32751 and is currently estimated at $388,718, approximately $281 per square foot. 1820 Rogers Ave Unit A is a home located in Orange County with nearby schools including Hungerford Elementary School, Maitland Middle School, and Edgewater High School.
Ownership History
Date
Name
Owned For
Owner Type
Purchase Details
Closed on
Apr 1, 2019
Sold by
Sapp Richard and Hoekstra Robert
Bought by
Robin D Rich Llc
Current Estimated Value
Home Financials for this Owner
Home Financials are based on the most recent Mortgage that was taken out on this home.
Original Mortgage
$135,750
Outstanding Balance
$119,347
Interest Rate
4.4%
Mortgage Type
New Conventional
Estimated Equity
$269,371
Purchase Details
Closed on
Feb 28, 2019
Sold by
Hoyleton Investments Llc
Bought by
Sapp Richard and Hoekstra Robert
Home Financials for this Owner
Home Financials are based on the most recent Mortgage that was taken out on this home.
Original Mortgage
$135,750
Outstanding Balance
$119,347
Interest Rate
4.4%
Mortgage Type
New Conventional
Estimated Equity
$269,371
Purchase Details
Closed on
Jan 8, 2016
Sold by
Brooks Pearl
Bought by
Hoyleton Investments Llc
Purchase Details
Closed on
Oct 30, 2002
Sold by
Brooks Charles C
Bought by
Brooks Pearl
Create a Home Valuation Report for This Property
The Home Valuation Report is an in-depth analysis detailing your home's value as well as a comparison with similar homes in the area
Home Values in the Area
Average Home Value in this Area
Purchase History
| Date | Buyer | Sale Price | Title Company |
|---|---|---|---|
| Robin D Rich Llc | -- | Attorney | |
| Sapp Richard | $181,000 | First Premier Title & Escrow | |
| Hoyleton Investments Llc | $107,500 | The Title Bridge Llc | |
| Brooks Pearl | -- | -- |
Source: Public Records
Mortgage History
| Date | Status | Borrower | Loan Amount |
|---|---|---|---|
| Open | Sapp Richard | $135,750 |
Source: Public Records
Tax History Compared to Growth
Tax History
| Year | Tax Paid | Tax Assessment Tax Assessment Total Assessment is a certain percentage of the fair market value that is determined by local assessors to be the total taxable value of land and additions on the property. | Land | Improvement |
|---|---|---|---|---|
| 2025 | $3,557 | $219,537 | -- | -- |
| 2024 | $3,254 | $219,537 | -- | -- |
| 2023 | $3,254 | $230,983 | $60,000 | $170,983 |
| 2022 | $2,639 | $173,660 | $30,000 | $143,660 |
| 2021 | $2,395 | $149,946 | $24,000 | $125,946 |
| 2020 | $2,274 | $146,963 | $20,000 | $126,963 |
| 2019 | $1,553 | $94,629 | $20,000 | $74,629 |
| 2018 | $1,467 | $89,636 | $17,000 | $72,636 |
| 2017 | $1,331 | $79,007 | $14,000 | $65,007 |
| 2016 | $69 | $54,755 | $9,000 | $45,755 |
| 2015 | $68 | $52,956 | $9,000 | $43,956 |
| 2014 | $67 | $42,765 | $8,000 | $34,765 |
Source: Public Records
Map
Nearby Homes
- 320 Eaton St
- 2031 Eaton St
- 301 Clark St
- 2031 Warrens Ave
- 840 Mulberry St
- 711 Thompson Ave
- 800 Thompson Ave
- 1100 Willowbrook Trail
- 25 People St
- 860 Park Lake Cir Unit 53
- 104 E Lake Colony Dr
- 840 Bethune Dr
- 1013 Grove St Unit 88
- 1019 Grove St Unit 85
- 530 Ruffel St
- 755 Cranes Ct
- 500 Vereen Dr
- 832 Park Lake Place Unit 6A
- 824 Town Cir Unit 101
- 132 Washington Ave
- 1820 Rogers Ave
- 1820 Rogers Ave Unit B
- 1812 Rogers Ave
- 1840 Rogers Ave
- 1830 Rogers Ave
- 213 Eaton St
- 141 Eaton St
- 1900 Rogers Ave
- 1811 Rogers Ave
- 1741 Fords Ave
- 1841 Rogers Ave
- 137 Eaton St
- 740 Kentucky Ave
- 131 Eaton St
- 1920 Rogers Ave
- 1730 Warrens Ave
- 215 Eaton St
- 225 Johnson Ave
- 1720 Warrens Ave
- 301 Eaton St