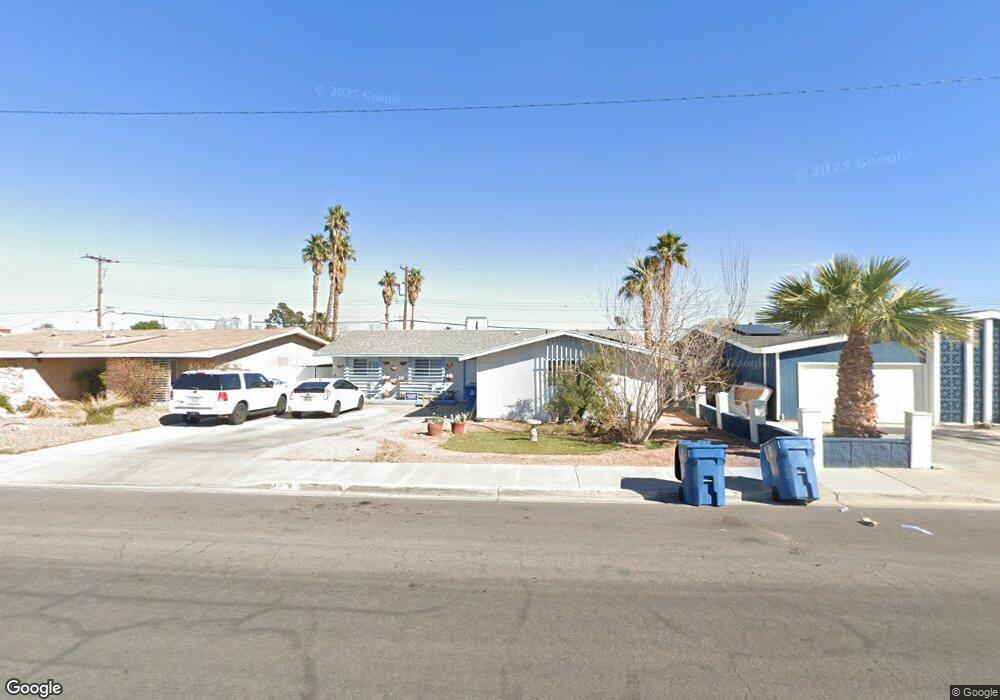
1820 Saylor Way Las Vegas, NV 89108
Michael Way NeighborhoodEstimated Value: $354,436 - $398,000
4
Beds
2
Baths
1,392
Sq Ft
$264/Sq Ft
Est. Value
About This Home
This home is located at 1820 Saylor Way, Las Vegas, NV 89108 and is currently estimated at $367,359, approximately $263 per square foot. 1820 Saylor Way is a home located in Clark County with nearby schools including Paul E. Culley Elementary School, Robert O Gibson Middle School, and Western High School.
Ownership History
Date
Name
Owned For
Owner Type
Purchase Details
Closed on
Feb 21, 2008
Sold by
Thompson Brack
Bought by
Thompson Kay A
Current Estimated Value
Create a Home Valuation Report for This Property
The Home Valuation Report is an in-depth analysis detailing your home's value as well as a comparison with similar homes in the area
Home Values in the Area
Average Home Value in this Area
Purchase History
| Date | Buyer | Sale Price | Title Company |
|---|---|---|---|
| Thompson Kay A | -- | None Available |
Source: Public Records
Tax History Compared to Growth
Tax History
| Year | Tax Paid | Tax Assessment Tax Assessment Total Assessment is a certain percentage of the fair market value that is determined by local assessors to be the total taxable value of land and additions on the property. | Land | Improvement |
|---|---|---|---|---|
| 2025 | $854 | $51,436 | $30,450 | $20,986 |
| 2024 | $829 | $51,436 | $30,450 | $20,986 |
| 2023 | $676 | $52,557 | $33,600 | $18,957 |
| 2022 | $805 | $42,811 | $25,900 | $16,911 |
| 2021 | $782 | $40,241 | $24,500 | $15,741 |
| 2020 | $756 | $36,632 | $21,350 | $15,282 |
| 2019 | $734 | $32,635 | $17,850 | $14,785 |
| 2018 | $713 | $30,336 | $16,450 | $13,886 |
| 2017 | $922 | $28,111 | $14,350 | $13,761 |
| 2016 | $676 | $25,213 | $11,900 | $13,313 |
| 2015 | $674 | $21,664 | $8,750 | $12,914 |
| 2014 | $654 | $19,913 | $6,650 | $13,263 |
Source: Public Records
Map
Nearby Homes
- 5712 Pinecone Place
- 5820 Gordon Ave
- 1700 Blue Mountain Dr
- 1710 Shadow Mountain Place
- 1864 Shadow Mountain Place
- 5329 Gaborone Ave
- 6008 Pebble Beach Blvd
- 3816 Vegas Dr
- 1452 N Jones Blvd
- 1401 N Michael Way Unit 118
- 1401 N Michael Way Unit 157
- 1336 N Jones Blvd
- 6224 Mandarin Dr
- 1120 Saylor Way
- 5128 Forrest Hills Ln
- 1744 Leonard Ln
- 6217 Yerba Ln
- 2021 San Simeon St
- 2132 Jeanne Dr
- 5104 Pebble Beach Blvd
- 1824 Saylor Way
- 1808 Timber Ln
- 1812 Saylor Way
- 1828 Saylor Way
- 5716 Pinecone Place
- 5800 Edrene Ave
- 5721 Carl Ave
- 1804 Timber Ln
- 5801 Carl Ave
- 5801 Edrene Ave
- 5717 Carl Ave
- 5804 Edrene Ave
- 1800 Timber Ln
- 5805 Carl Ave
- 1804 Saylor Way
- 5805 Edrene Ave
- 1900 Saylor Way
- 5713 Carl Ave
- 5808 Edrene Ave
- 1720 Timber Ln